Click here to have these notes read to you (Chrome).
Strand 4.1: National Income.
National Income Statistics:
These are compiled by the CSO (Central Statistics Office) and are needed for the following reasons:
They are used to measure growth
They are needed to make international comparisons
They show whether the standard of living is improving or not.
The data shows what is causing growth, e.g. the building sector, big pharma, etc. This should help the government better manage the economy and not allow the economy to become over-reliant on one sector, as it was prior to the crash of 2008/
Limitations of National Income Statistics:
A rise in national income may simply be due to higher prices rather than increased output. To overcome this problem, the CSO measures national income at constant prices. This eliminates the problem of inflation.
The national income of China may be many times higher than Ireland, therefore the CSO measures national income per capita (per person).
The distribution of wealth is not considered, therefore two countries could have similar GDP/capita figures yet all of the citizens of one country may be well off while only the top 2% of the other country enjoy high standards of living.
Work that receives no financial reward is not counted despite the contribution it may make towards the betterment of others, e.g. the work of housewives/husbands.
National income statistics do not consider the type of goods produced, e.g. an increase in GDP may be due to increased weapons production which may not improve the welfare of citizens. Another country may have a large child-mining sector, which would benefit a lot of people but might not add much to national income.
People may produce more in a given year, but this may be because they are working much longer hours consequently their standard of living may have decreased.
Black/grey market is economic activity that is not recorded yet may contribute significantly to people’s standard of living. This is more commonly called the hidden economy nowadays. In addition, black market activity may ultimately shrink national income figures while contributing to people’s welfare.
Three methods used to calculate National Income:
Expenditure method: This calculates expenditure by consumers, firms, the government and foreign markets on domestically produced goods. (Y = C + I + G + (X – M)). Care must be taken to avoid double-counting here where the same economic transaction is inadvertently counted more than once.
Production method: Also known as the ‘Output Method’ and counts the value of all goods and services produced by all sectors of the economy. All firms are legally obliged to provide the state with information on the total value of their output.
Incomes method: This is where the income of each individual in the state is added together. The CSO collects this information from the Revenue Commissioners. Transfer payments are not included, e.g. payments for which no factor of production is supplied like dole, state pensions and child benefit. Incomes-in-kind are included.
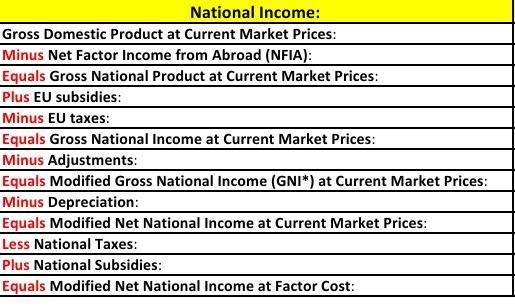
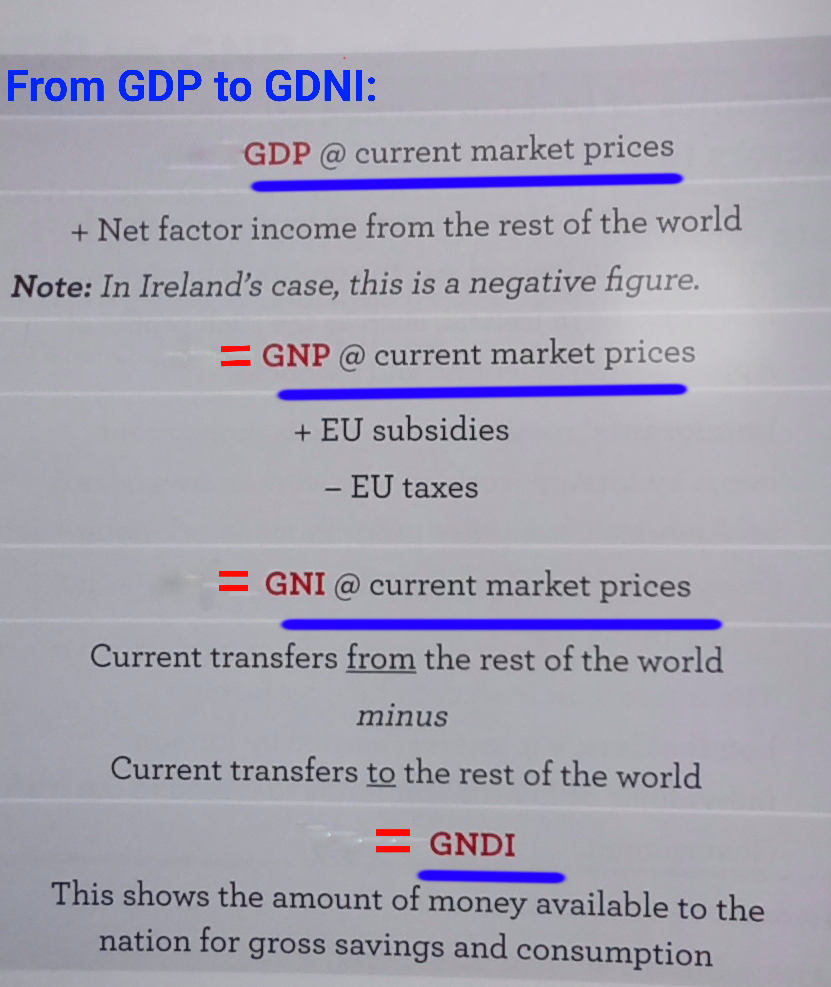
Definitions used in national income accounts:
GDP at current market prices = all goods produced in Ireland.
GNP at current market prices = GDP + NFIA.
GNI at current market prices = GNP at current market prices plus EU subsidies, minus EU taxes.
NNI at current market prices = GNI at current market prices minus depreciation.
NNP at factor cost = NNI at current market prices less national taxes plus national subsidies.
To go from gross to net – subtract depreciation
To go from factor cost to current market prices - add taxes and subtract subsidies
To go from domestic to national – subtract NFIA.
In summary:
This video explains a lot of the commonly examined material on GDP and GNI.
Uses of national income statistics:
To assess the trend in a country’s income over a number of years.
To make international comparisons.
To assist the government in choosing the correct policies for the country.
Limitations of national income statistics:
We must use constant prices
Each country’s output must be expressed in the same currency, usually $US.
The population of each country must be known, i.e. only GDP/capita provides a proper comparison.
GDP/capita does not consider the distribution of wealth.
GDP figures do not include ‘non-market economic activities’.
GDP/capita does not take account of the number of hours worked.
GDP/capita does not consider the nature of the goods produced, e.g. a country’s entire GDP might be made up of weapons manufacture which would be of no use to the ordinary citizens of that country.
GDP/capita does not consider the level of state involvement in a society, e.g. perhaps all health and education costs are covered by the state.
Some countries export a lot which helps the value of their currency relative to other currencies. Others may export less thus reducing the comparative value of their currency, yet both countries may produce a similar amount of goods.
GDP does not measure other factors affecting welfare. The UN HDI considers factors like life expectancy, adult literacy, school enrolment, educational attainment, whether average income is sufficient to meet basic needs, and per capita GDP.
Factors Affecting the Size of National Income.
The Circular Flow of Income (click here to see how to draw this diagram with the help of the log tables):
The circular flow of income is a basic model of how an economy operates. A leakage is anything that causes a reduction in the circular flow of income. An injection is anything that causes a rise in the circular flow of income.
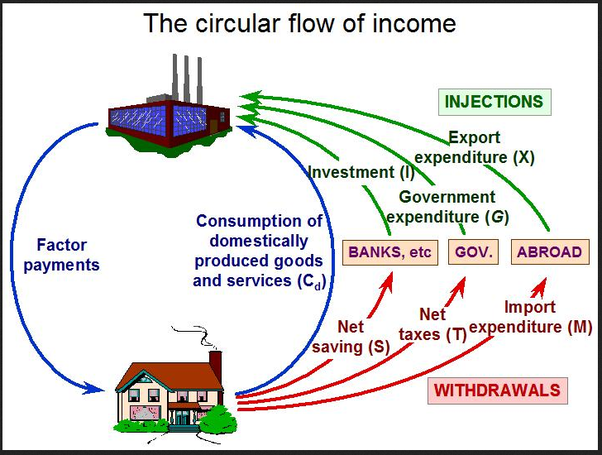
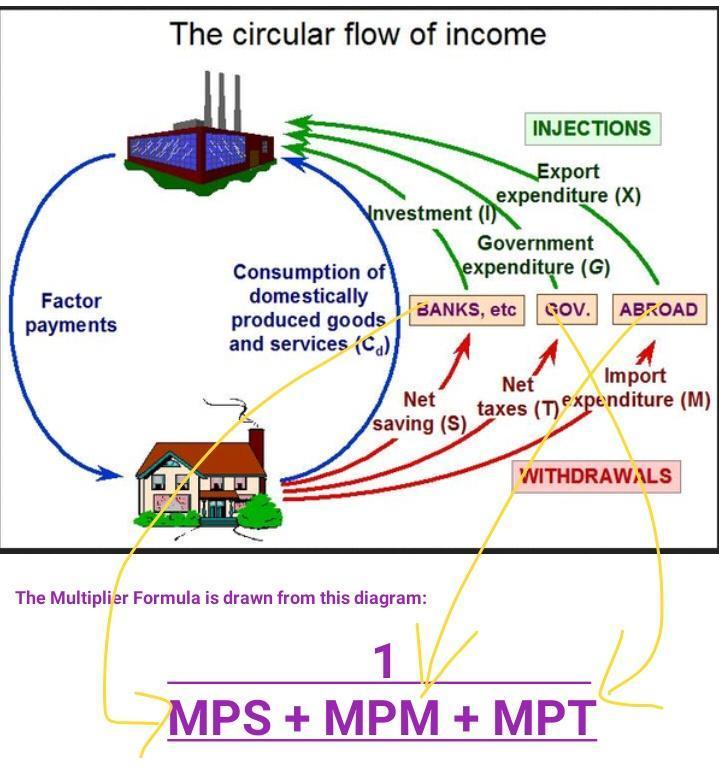
The second diagram shows the link between the Circular Flow of Income and Multiplier. This video explains the basic maths of the multiplier. This podcast explains the logic behind the multiplier.
Key Terms:
Net National Product at Factor Cost: (national income) measures the income earned by the permanent residents of a country in a year accounting for NFIA.
Net Domestic Product at Factor Cost: refers to the income earned by the permanent residents of a country not accounting for NFIA.
Gross Domestic Product at Factor Cost: refers to Net Domestic Product at Factor Cost plus depreciation.
Gross National Product at Factor Cost: refers to Gross Domestic Product at factor cost plus NFIA.
Gross National Product at Current Market Prices: refers to GNP at factor cost plus indirect taxes minus subsidies.
Gross Domestic Product at Current Market Prices: refers to GNP at current market prices minus NFIA or C + I + G + (X – M)
Gross national income, GNI: comprises domestic and foreign income (e.g. if an Irish person was in receipt of a pension from previous employment in England, or had a savings account that paid some interest each year) earned by the resident population of a country.
Gross national disposable income, GDNI: may be derived by adding national income to net current transfers.
GNI*, or GNI modified: is defined as GNI less the effects of profits of redomiciled companies and the depreciation of intellectual property products and aircraft leasing companies. In 2015 Irish GDP was 26.3% which was considered extremely high. However this huge increase in GDP was due to the level of multinational asset transfer into the Irish economy (c. €300 billion). Furthermore an aircraft leasing company moved the domicile of its fleet into Ireland at a value of Eur35 billion, and Apple moved some of its valuable intellectual property assets to Ireland. It was during this time that the phrase “leprechaun economics'' became popular. GNI* was subsequently introduced to exclude such globalisation effects that we’re disproportionately impacting the measurement of the Irish economy.
Important considerations when assessing National Income statistics:
GDP vs GNP: in Ireland GDP tends to be larger than GNP. This is due to two reasons, 1. Repatriation of profits by MNC's, and 2. The interest payments on Irish debt held by non-residents exceeds the interest payments that residents receive on non-Irish debt. Therefore GDP is a better indicator of the level of economic activity in Ireland, while GNP is a better indicator of the standard of living in Ireland.
GDP vs GNI: the profits of a US owned company operating in Ireland will count towards Irish GDP but they are repatriated to the US s and so count towards US GNI. These repatriated profits will be reflected in a decreased GNI for Ireland however GDP will remain unchanged.
GNP vs GNI: the difference between GNP and GNI is interest and dividends.
GNI vs GNDI: DNA is largely considered to be a better indicator of a population’s income. It also captures the incomes related to the mobility of factors of production i.e. wages earned by cross-border workers which are also described as net primary income or NPI. However GNI does not record unilateral transfers including foreign aid and remittances which are known as net secondary incomes or NSI. GNDI thus provides a much better account of the income that is available to people and is a much better indicator than GNI of the living standards of the people in the country.
Depreciation:
If gross appears in the term, then depreciation has not been accounted for. To go from a 'gross' figure to a 'net' figure, subtract depreciation.
Net Factor Income from Abroad (NFIA):
NFIA is calculated by subtracting the income earned by foreign firms and individuals in Ireland from the income earned by Irish firms and individuals abroad.
If the word 'domestic' appears in the term, then NFIA has not been accounted for.
If the word 'national' appears, then NFIA has been accounted for.
GNP takes NFIA into account. This is why GNP is seen as a more accurate measure of national income than GDP (however, GDP is the figure used for international comparisons).
Factor Cost and Market Prices:
When goods and services are valued at factor cost, it means they are valued at the cost of the factors used to produce them.
When goods and services are valued at market prices, it means they are valued at the prices paid for goods in the market. To get from factor cost to market price indirect taxes need to be added (as they make market prices higher) and subsidies need to be subtracted (as they help lower market prices.
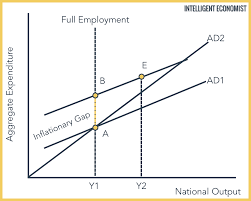
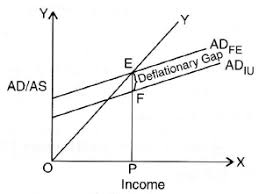
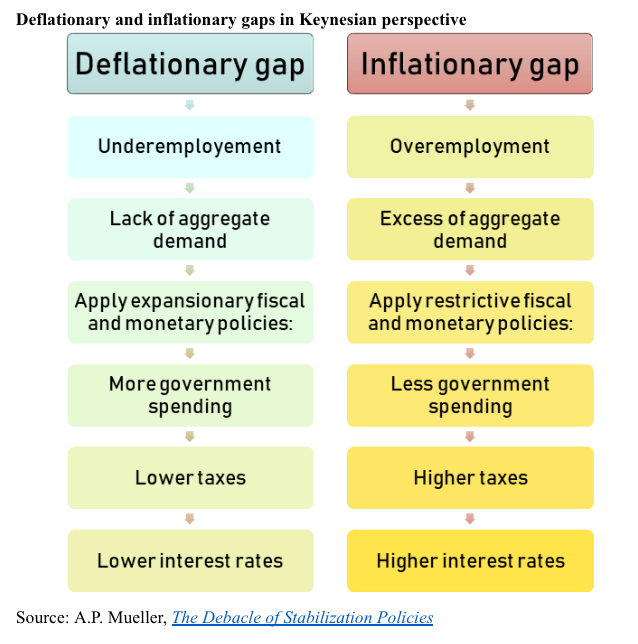
The Inflationary and Deflationary Gap:
If GDP (actual) – GDP (potential)
GDP (potential) is a positive figure, there will be an inflationary gap. If it’s negative, there will be a deflationary gap.
If the level of National Income exceeds the level needed to sustain full employment there is an inflationary gap. If it’s less than the level needed to sustain full employment, there is a deflationary gap. (Full employment is 96.4%).
Note: The difference between the level of National Income and the level needed to achieve full employment must be calculated using the multiplier, i.e. if the level of National Income needed to achieve full employment is €180bn, and the actual level is €160bn, and the multiplier is 5, then the increase needed is €4bn.
Using diagrams to illustrate this point: When consumption is greater than national income, there is said to be an inflationary gap. Likewise, when consumption is less than national income, there is a deflationary gap.
The Multiplier:
The multiplier refers to the number of times an injection into the economy leads to an increase in national income. Have a listen to this short podcast on The Multiplier.
Take as an example Mark gets €10 in pocket money. He spends €8 of this on a haircut. The hairdresser then spends €7 on groceries in the local shop. Finally, the shopkeeper spends €5 on a taxi. Of the initial injection of €10, national income increased by €30 (10 + 8 + 7 + 5). This means that the multiplier in this example is 3. The value of the multiplier is heavily influenced by the confidence consumers have in the economy.
What affects the size of the multiplier?
MPC: The Marginal Propensity to Consume is the fraction of extra income that is spent on goods and services. MPC is found by calculating the change in consumption over the change in income.
MPS: The Marginal Propensity to Save is the fraction of extra income that is saved. MPS is found by calculating the change in savings over the change in income.
MPT: The Marginal Propensity to Tax is the fraction of extra income that is spent on taxes. MPT is found by calculating the change in taxation over the change in income.
MPM: The Marginal Propensity to Import is the fraction of extra income that is spent on imports. MPM is found by calculating the change in imports over the change in income.
What does consumption depend on?
The level of income irrespective of source.
The availability of credit.
The rate of interest (is the rate of interest is low consumers will borrow and spend more).
The rate of income tax.
What does investment depend on?
The cost of capital goods
The expectations of business people
Government expenditure (people are much more likely to invest if government support is available)
The productive capacity of the economy (a country with a lot of raw materials will have a higher GDP than a country that needs to import these things)
The state of technology.
What do exports depend on?
The level of income abroad
Competitiveness
The value of the euro (a week's euro would make our exports more attractive)
Government incentives (the more supports that are in place for companies the larger Irish exports are likely to be)
What do imports depend on?
The availability of goods, eg oil
Foreign prices vs domestic prices
The level of income is here
The value of the euro
The marginal propensity to import, MPM
The economic effects of an increase in the rate of savings on the Irish economy:
Reduced spending
Reduced inflation
Reduced demand for imports
Increased level of funds available for investment
More capital for the banks
More revenue for the government from DIRT.
What is the impact of transfer payments on the multiplier?
Transfer payments are payments received for which no factor of production has been supplied. Generally the person in receipt of a transfer payment has a high MPC. Consequently this person is likely to spend all or most of the money that they receive each week. Transfer payments help to move into the economy quickly and have a positive effect. Concept of universal basic income, or UBI needs to be understood here also.
Human Development Index:
The HDI is a comparative measure of life expectancy, literacy, education and standard of living for countries worldwide. It has been used since 1993 by the UN Development Programme in its annual Human Development Report. Some people refer to it as the Happiness Index.
What is a trade cycle?
A trade cycle refers to a period of time when the economy goes from recovery to boom to recession to depression.
Phase 1: recovery. The economy starts from a position of high unemployment with low prices and output. an increase in investment with the multiplier effect leads to increased incomes and demand. This increased level of demand leads to a further increase in investment capital which leads to further economic activity and recovery.
Phase 2: boom. The level of employment increases and any further increases in demand cannot be satisfied by increases in production. This leads to inflation.
Phase 3: recession: A recession is when GDP falls consecutively over 2 quarters. The boom comes to an end when output is at full capacity and investment begins to decrease. Incline investment leads to a fall in consumption. As pessimism begins to spread the demand for new capital equipment falls significantly.
Phase 4: depression: In many trade cycles phase 1 occurs after phase 3, but in extreme cases there can be a deep fall out of economic activity which is called a depression. If GDP declines by more than 10%, there is said to be a depression.
Relevant factors when assessing the average standard of living in a country:
Population – the distribution of GNP is affected by the size of the population.
Distribution of wealth has a huge bearing on socio-economic wellbeing.
Unemployment – High levels decrease average standard of living.
Government Services – if health, education and social welfare provisions are good, then people are better off even if GNP is not high.
Inflation – if inflation is very high then GNP figures will not represent the true standard of living.
Nature of goods produced – a large percentage of the GNP could be generated through the production of nuclear weapons.

The Factors determining the size of National Income:
The stock of the factors of production and the quality of that stock, e.g. Germany after World War II.
The state of technology in the economy, e.g. availability of broadband.
The productive capacity of the country.
The national economic climate – are people confident about the future?
The international economic climate – National Income will not increase during a worldwide recession.
The level of aggregate demand.
Aggregate Demand:
Total expenditure on all goods both consumer goods and capital goods by both the private sector and the public sector, i.e. Y = C + I + G + (X – M).
Autonomous Consumption:
This is the level of consumption that is not dependent on income, i.e. it is financed through savings or borrowings. When this happens, dis-savings are said to take place.
The Accelerator Principle:
This principle states that small changes in consumer spending can cause bigger percentage changes in investment, e.g. if a student cycles from Ballinagh to school each day, he may invest in a new bike every year at a cost of €500. However, if his family moved home to Kilnaleck, the student may be forced to invest in a car at a cost of €5,000. In this example a small increase in demand led to a massive increase in investment.
What are the economic and social effects of a rise in the hidden economy?
Loss of tax revenue to the government
A decline in legitimate business activity
Increased government expenditure on law enforcement
The standards of products and services can be hard to maintain
A threat to jobs.
Increase in crime levels
Public outrage
Moral hazard
A decrease in the provision of public goods and services.
What can the government do to discourage hidden market activity?
Reduce direct taxation
Reduce indirect taxation
Better enforcement by the Revenue Commissioners
Educate the public about the importance of tax revenue to the state
Simplify the tax system and close loopholes
Encourage a culture of ethical business.
Key economic indicators: (You will need to know these figures to illustrate your macro-economic answers in the exam - visit tradingeconomics.com for up-to-date data)
GDP
Government expenditure
Inflation
Unemployment
National debt
Strand 4.2: Fiscal policy and the budget framework.
Where does the government get its money?
There are two types of revenue, current and capital.
Current Revenue:
This includes direct and indirect tax revenue like customs, excise duties, capital gains tax, capital acquisitions tax, stamp duties, income tax, corporation tax and VAT. It also includes non-tax revenue like Central Bank surplus income, national lottery surpluses, and dividends of state owned companies.
Other current revenues include interest on loans to semi state companies and the local authorities, fees charged for state services e.g. obtaining your passport, and state savings schemes e.g. prize bonds.
Capital revenue:
These include loan repayments from local authorities, borrowing on the bond market, grants and loans from foreign international institutions and the EU, at the sale of state assets.
There are also two types of expenditure, current and capital.
Current expenditure:
This is money spent on items used up on a day-to-day basis, e.g. the salaries of public servants and social welfare payments.
Capital expenditure:
This is government expenditure on items not used up during the year but rather on things that increase the productive capacity of the country e.g. roads, railways, ports.
Some key terms on the budget:
Exchequer balance: this is the difference between the total receipts in the Exchequer minus the total expenditure (capital and current).
Current budget deficit: this is when government current expenditure exceeds government current revenue.
Current budget surplus: this is when government current revenue exceeds government current expenditure.
Balanced current budget: this is when revenue equals expenditure.
Inflationary budget: this is when revenue expenditure is increasing or taxation is decreasing.
Deflationary budget: this is when revenue expenditure is decreasing or taxation is increasing.
Neutral budget: this is a budget that is neither inflationary nor deflationary.
Revenue buoyancy: this is when the actual tax revenue collected during the year is greater than what had been planned for. If revenue is greater than expenditure it has a deflationary effect on the economy, which is also known as fiscal drag.
What can the government do to reduce the current budget deficit?
It can increase direct or indirect taxes but this can cause a rise in hidden economic activity, a fall in aggregate demand, and higher unemployment which will actually make the situation worse.
The government can also reduce expenditure but this can make the situation worse as well l&b causing a short-term shock to the economy, which can lead to a fall in aggregate demand and knock-on negative effect on employment. The economist David McWilliams says that these problems are more likely when economists think like accountants instead of seeing the economy as a living organism.
What can the government do to increase a current budget surplus?
It can reduce both direct and indirect taxes which will give people more disposable income and encourage them to spend more. The government can also create employment in areas like health and education which will provide it with more tax revenue and also increase aggregate demand in the economy.
Fiscal policy:
Fiscal policy is any action taken by the government that influences the timing magnitude or structure of current revenue and expenditure. John Maynard Keynes what’s the first to advocate the use of fiscal policy to stimulate the economy during the great depression of the 1930s. This is known as Keynesian economics and was gradually replaced by monetary policy during the 70s and 80s.
Types of fiscal policy:
Neutral fiscal policy. This refers to a structure of taxes and transfers that keeps the income distribution unchanged even after positive or negative shocks to an economy. Government spending is covered by tax revenue. Fiscal neutrality implies that attacks should not distort economic behaviour, in other words the government is neither trying to boost aggregate demand nor reduce it.
Expansionary fiscal policy. This involves decreasing taxes and increasing expenditure in order to fight recessionary pressures. It has the effect of increasing employment which can also worsen the government budget deficit as there is increased spending.
Contractionary fiscal policy. This involves increasing taxes and decreasing government expenditure in order to fight inflationary pressures.
The limitations of fiscal policy in stabilising business cycles:
It can take several months for a government decision on taxation or expenditure to filter through to the economy.
Some argue that higher government spending will simply discourage the private sector from investing in the economy.
It is also argued that government spending tends to be much less efficient than private sector spending.
If the government borrows heavily to fund expansionary fiscal policy this can lead to higher bond yields.
Monetary and fiscal policy do not act independently of each other, therefore contractionary monetary policies as implemented by the ECB could easily negate any fiscal measures taken by the government to help the economy.
How does being a member of the EU and the eurozone influence Ireland’s ability to implement a fiscal policy?
While fiscal policy is decided on by the Irish government we do have some responsibilities as a member of the European Union and the European monetary union. The European commission has presented its roadmap for deepening monetary union within the EU. Proposals include:
Establishing a European monetary fund
Integrating the Treaty on Stability, Coordination and Governance (TSCG) into the EU legal framework.
Establishing clarity on new budget airy instruments for a stable euro area.
Adding to the structural reform support programme and mobilising EU funds in support of national reforms.
The main responsibilities of the European fiscal board (EFB) are:
Provide ad hoc advice to the commission president.
Evaluate the implementation of the EU fiscal framework and the appropriateness of the actual physical stands at euro area and national level.
Make suggestions for the future evolution of the EU fiscal framework.
Cooperate with the national independent fiscal councils.
Assess the prospective fiscal stance appropriate for the Euro area as a whole within the rules of the stability and growth pact.
The Economic Objectives of Government; & the Role of Government in the Economy.
Role of the Government in the Economy:
The government is responsible for the:
Provision of essential services – e.g. the Civil Service, An Garda Siochana, the defence forces, the postal services, the education system and the health service.
Provision of services that require large amounts of capital – e.g. the rail network and the electricity supply, things in which a private entrepreneur could not afford to invest.
Promotion of the national interest – Failte Ireland promotes Ireland as a tourist destination. IDA Ireland promotes Ireland as a suitable place to invest. Agencies such as these could not be set up by private individuals as no profits are earned from the promotion of other businesses.
Controlling of the economy – The government aims for price stability, high or full employment, positive economic growth, a good infrastructure, increased exports and controlled spending.
Key aims of government:
Full employment: This is when everybody who seeks work can find work at the existing wage levels. A 4% level of unemployment is considered to be full employment (statistically 4% of people will not work under any circumstances).
Economic Growth: This refers to the increase in national income without changes in the structure of society (if there are changes to the structure of society it is called economic development).
Price Stability: The government hopes to keep inflation under control so as to protect the purchasing power of money.
Improvements in Infrastructure: In order to encourage enterprise the government spends large amounts of money each year on roads, railways, ports, electricity, water supplies, etc. This helps to attract direct foreign investment (FDI) and encourages the establishment of domestic businesses. A good infrastructure also improves the living standards of the citizens of a country. The National Development Plan, 2000 – 2006, involved the investment of €57bn of public, private and EU funds on infrastructural development. The NDP 2007 – 2013 planned to spend €184 bn however, this has been cut drastically. Transport 21 was the capital investment framework for the development of the transport system between 2006 and 2015. It planned to spend €34bn. Again, this has been revised downwards.
Increased Exports: In order to increase the flow of money into the country and boost national income (injections), the government promotes and encourages firms that export finished goods (visible exports). The government also promotes invisible exports such as tourism.
Reduced Government Borrowing: Current budget deficits lead to increased borrowing which is a burden for future taxpayers. Our current budget deficit is running at well over €10bn p.a.
Balanced Regional Development: The government tries to ensure that economic development is not confined to the cities or the east coast.
The Achievement of Social Aims: The government hopes to achieve a fairer society by providing certain essential services to poor people free of charge.
Tools of Government Economic Policy:
Fiscal Policy: This refers to the ability of the government to alter taxes and government spending to achieve its objectives. For example, to achieve price stability, the government could increase income tax and decrease government spending, thereby reducing demand (and demand-pull inflation). To boost economic growth, the government could reduce taxes and increase spending. The ability of the government to use fiscal policy is restricted by the monetary policy pursued by the ECB.
Social Partnership and Economic Planning: The social partners include representatives of different sectors of the Irish economy such as workers, employers, trade unions, farmers, business, industry and representatives of the unemployed. Policies in relation to areas such as productivity, housing, social welfare, wage increases and taxation are agreed upon at national level. Such planning has positive economic benefits such as the reduction of industrial unrest, creating economic stability, controlling inflation, encouraging investment and increasing GDP. The Landsdowne Road Agreement is the current agreement governing pay in the public sector.
Direct Intervention in the Economy: The government can intervene directly in the economy by setting up a state agency or semi-state company, e.g. the ESB, Failte Ireland. The government can also directly influence wage levels as they did under the National Minimum Wage Act, 2000.
Regional Policy: In order to achieve balanced regional development, the government can provide incentives that encourage economic activity in less developed areas of the country, e.g. Leitrim. They can provide grants and tax incentives for businesses to locate in such areas. The National Development Plan is supposed to coordinate these activities. The decentralisation plan hoped to move several government departments out of Dublin in an effort to achieve balanced regional development. As of Jan. 2012 this scheme was abandoned as far too few civil servants opted to leave Dublin.
Prices and Incomes Policy: This is where the government controls price increases and at the same time restrains wage increases. By successfully pursuing such a policy, inflation is controlled.
Monetary Policy: Carried out by the Central Bank in accordance with directives from the ECB. It involves the money supply, the rate of interest and the availability of loans.
Conflicts between the Economic Aims of the Government:
One of the many problems the government of any country faces when trying to achieve its economic aims is that policies that are pursued to achieve one economic aim may conflict with another economic aim. Examples of this type of conflict include:
In achieving full employment, incomes will rise and so too may demand-pull inflation. The Phillips Curve considers the relationship between inflation and the rate of unemployment, and is well worth examining.
Policies designed to encourage economic growth can also fuel inflation.
In order to boost the economy, the government may spend more than it takes in thereby incurring a current budget deficit. While this would boost economic activity, increase growth and reduce unemployment it would conflict with the aim of reducing government borrowing. It could also cause inflation to rise.
Taxation:
Direct Taxes are those on incomes and wealth. Examples include PAYE, DIRT, CGT (Capital Gains Tax is charged on the gains made from the sale of an asset), Capital Acquisitions Tax (this is a tax on items acquired by an individual, e.g. an inheritance, Corporation Tax which is a tax on the profits of a company.
Indirect Taxes are those on goods and services. Examples include VAT, Excise Duty which is levied on goods that have certain negative effects like alcohol and tobacco, and oil-based products, Tariffs/Customs Duty are charged on imports, Stamp Duty is charged on transactions and documents, e.g. when buying a house or writing a cheque stamp duty is payable.
Key Terms:
Regressive Tax – one that does not consider ability to pay, e.g. tv licence.
Progressive Tax – one that takes account of ability to pay, e.g. PAYE.
Tax Avoidance – legally paying less tax.
Tax Evasion – illegally paying less tax.
Tax Wedge – the difference between the cost to an employer of his employee and the take-home-pay of the employee as a result of taxation, i.e. the total tax paid by both employer and employee in the form of PAYE, PRSI and Employers PRSI
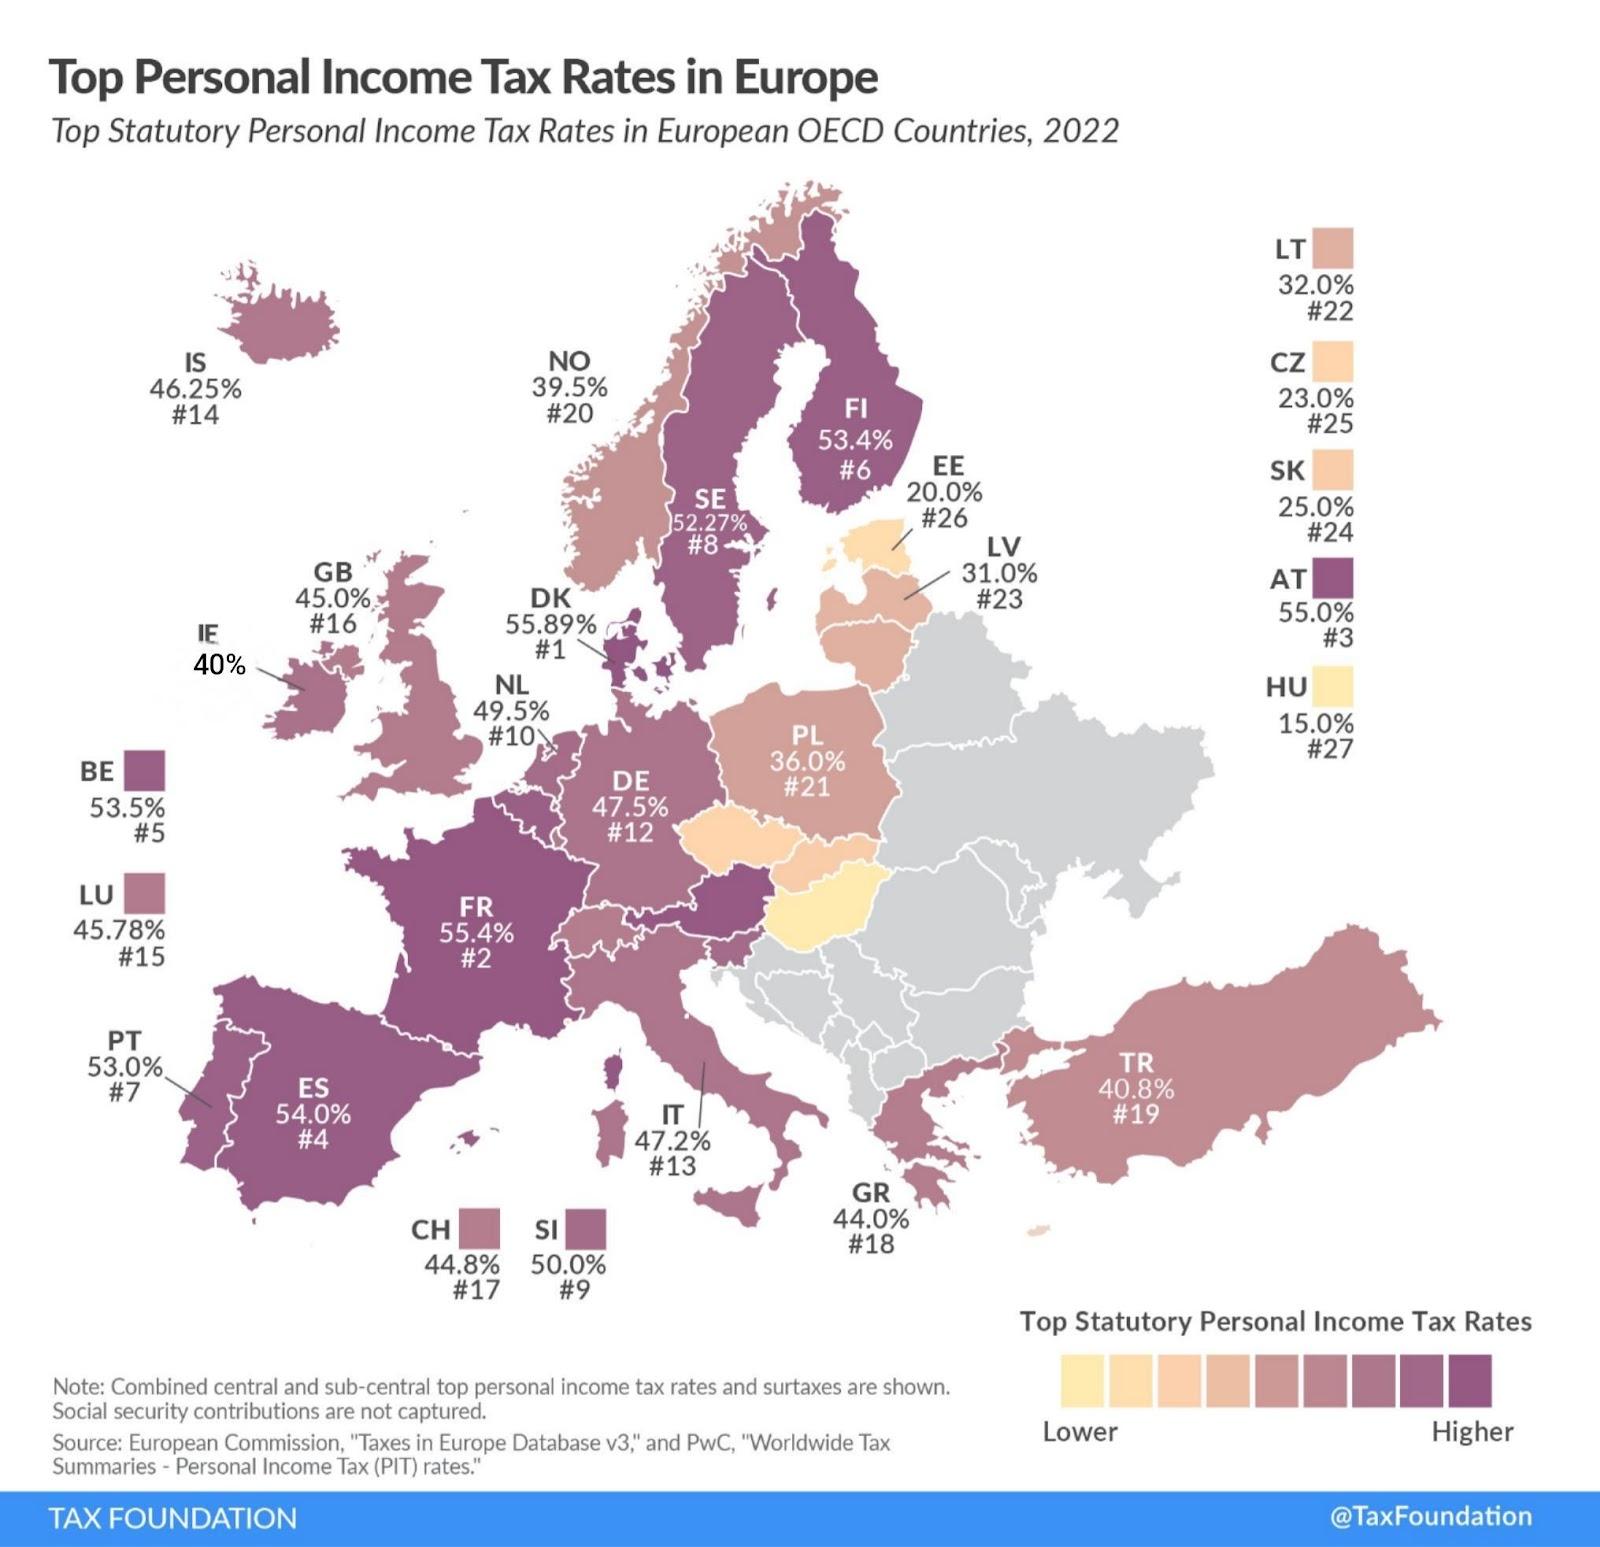
Tax harmonisation – a policy of the EU that aims to make tax regimes similar in all EU member states, e.g. the EU would like to see our Corporation Tax rates harmonised with the rest of the EU.
This image compares levels of taxation across Europe:
The Canons of Taxation:
According to Adam Smith (Wealth of Nations, 1776), a good taxation system should adhere to the following principles:
Equity – the system should be fair.
Economy – it should not cost more to collect the tax than the amount being collected.
Certainty – the taxpayer should be certain of his/her tax liability.
Convenience – tax should be collected in a manner convenient to the taxpayer.
Advantages of Direct Taxes:
Positive economic consequences of increasing direct taxes include:
Equity – High earners pay more.
Economy – Direct taxes are cheap to collect.
Certainty – Everyone can easily calculate their tax liability.
Convenience – Direct taxes are easy to collect.
Adjustable – Direct taxes are very easy to adjust up or down.
Disadvantages of Direct Taxes:
Direct taxes also have negative economic effects:
Work may be discouraged.
Investment may also be discouraged.
The black economy may increase – workers may be more inclined to work “under-the-counter”.
Savings are discouraged – as DIRT increases people feel they may as well spend their money now.
Advantages of Indirect Taxes:
Economy – they cost very little to collect.
Work and investment is not discouraged by indirect taxes.
Indirect taxes can be used to achieve other socially desirable results, e.g. cutting down on smoking.
Environment issues – indirect taxes can also encourage environmentally sound activities, e.g. walking to school.
Disadvantages of Indirect Taxes:
Inequitable: they are often seen as unfair.
Inflationary: they increase the prices of goods and services and so contribute to inflation.
The Government Budget:
The budget is divided between the current budget and the capital budget.
The Government Current Budget: This is commonly known as “the Budget” and is the current income and current expenditure of the government over a year. A budget can be either deficit (expenditure exceeds income), surplus (income exceeds expenditure) or balanced (income equals expenditure). Implications of a current budget deficit include:
Borrowing will rise to meet the shortfall.
Inflation may increase as the government injects more money into the economy that it takes out.
Economic growth may occur as the increase in government spending will increase the national income.
Improvement in services resulting from increased government spending.
Implications of a current budget surplus include:
Inflation may fall as the government is spending less than it takes out of the economy.
Decreased economic activity.
Reduction in services.
Reduction in government borrowing.
Increased pressure on the government as workers may demand tax cuts and public sector employees may demand wage increases. Representatives of the less well-off may call for increased social welfare payments, better healthcare provisions, public transport and education.
The Government Capital Budget: The capital budget deals with income and spending of a one-off nature. The capital budget is prepared at the same time as the current budget.
Central government capital income refers to money received by the government on a once-off basis, e.g. a current budget surplus, loans and EU grants.
Central government capital spending refers to money spent by the government on a once-off basis, e.g. spending on infrastructure and payments to reduce the national debt.
Local Government Budgeting:
County Councils, Urban District Councils and City corporations are examples of local government.
Current Income of Local Government: Examples of income received on a continuous basis by local government include:
Charges for locally provided services, e.g. parking, rubbish collection, parking and litter fines.
Rents from local authority accommodation.
Current Spending of Local Government: Examples of money spent on a continuous basis by local government include;
Administration costs of offices.
Salaries of employees.
Capital Income of Local Government: Money received on a once-off basis includes grants and loans from the central government.
Capital Spending of Local Government includes repayment of loans and investment in local infrastructure.
The National Debt:
The National Debt is the total amount of money owed by the government to Irish and foreign financial institutions and individuals. Our National Debt is currently (Nov. 2014) €203bn. The NTMA manages our debt and is also responsible for managing the National Pensions Reserve Fund as well as the State Claims Agency. The NTMA also handles the Dormant Accounts Fund.
The national debt/GDP ratio measures the size of the national debt in relation to the GDP of a country. In the early 1990’s the debt/GDP ratio was 90%, but by 2005 it had fallen to 27.6%. It is now around 90%.
A crucial element to our understanding of National Debt is the Bond Market. Click here for an explanation of the link between 10Y bond yields and the state of the economy.
The Public Sector Borrowing Requirement (PSBR):
This refers to government borrowing for the following reasons:
Exchequer Borrowing Requirement (EBR) made up of the Current Budget Deficit and money borrowed for capital purposes.
Money borrowed for state-sponsored bodies and local authorities.
Disadvantages of a large National Debt:
All money borrowed must be repaid with interest. Resulting from the current bailout, the interest payable on parts of our National Debt has increased to nearly 10%.
Taxpayers of the future must repay the loans, with interest. This negatively impacts on their ability to borrow.
Deadweight debt, which is money borrowed for projects that yield no revenue, further increases the burden on taxpayers. Self-financing projects can generate income which could be used to repay some of the money borrowed to finance them.
Advantages of a large National Debt:
Economic activity can be increased as the government can spend more money than it has. This can lead to positive knock-on effects like increased employment, better government services and increased national income.
Money spent on self-financing projects, e.g. toll roads, can benefit society without significantly adding to the burden of national debt.
Privatisation – For and Against:
Privatisation is the sale of government owned firms to private individuals or organisations. Telecom Eireann was sold to the private sector and became Eircom plc (now Eir), the government also sold 75% of Aer Lingus to the private sector.
The following are some of the advantages of privatisation:
Loss making companies are no longer a burden on the state.
Privately owned firms tend to have more access to funding than state-owned ones.
Privately owned firms tend to be more efficient. They cannot rely on the taxpayer to cover their losses the way state-owned companies can.
The sale of a semi-state can provide a huge cash injection to government finances (capital income).
These are some of the disadvantages of privatisation:
If the government sells profitable companies then it loses out on all future revenue from this source.
Inefficient firms may prove difficult to sell.
There may be widespread job losses as the new owners seek to make the company more efficient.
Certain services may be eliminated under privatisation, e.g. if Bus Eireann were privatised, some of its less profitable routes would be abandoned thus depriving people along these routes of a necessary service.
Private Costs, Social Costs and Social Benefits:
A private cost of a good/service is the cost to the individual/firm that uses it. By contrast, a social cost of a good/service is the cost to society as a whole. The private cost of smoking is the cost borne by the smoker, whereas the social costs are the health care costs which must be paid by society as a whole. Absenteeism from work and litter on the streets are other social costs which must be borne by society.
A social benefit of a good/service is the benefit to society resulting from consumption of that good/service. Society as a whole benefits from a good road network. Travel times are reduced, people can decentralise out the larger towns and cities. However, there are social costs too, including damage to the environment and local heritage sites, increased property prices as city dwellers sell up and buy property in the countryside. Some argue that the money used to develop our road network has yielded no benefits, e.g. the M3 is grossly under-utilised as motorists drive the old road to avoid paying tolls.
Some examples of Irish semi-states:
Córas Iompair Éireann (CIE)
Electricity Supply Board.
Raidió Teilifís Éireann (RTE)
Voluntary Health Insurance Board (Vhi Healthcare)
Horse Racing Ireland.
Teilifís na Gaeilge.
Bord Bia (Food Board)
Strand 4.3: Employment and Unemployment.
Key terms:
Full employment: refers to a situation where everyone who wants a job can find one. If employment reaches 96.4% there is said to be full employment (some people will never work no matter what opportunities are available while other people find themselves ‘between jobs’). Click here to view trends over the past few decades.
The labour force: comprises those in employment and those who are seeking work while the workforce are those actually in employment.
The participation rate: refers to the proportion of the total population of a country that is in the labour force.
Underemployment: refers to workers whose skills or talents are not used to their full potential. It can occur where a highly qualified person is working in a low skilled job; or where someone gets a job in the family business but doesn’t increase the turnover of the enterprise. Labour hoarding is another example of underemployment and it occurs when firms hold on to employees during a downturn in order to cut down on the costs of re-hiring when the economy picks up.
The unemployment rate: is expressed as a percentage of unemployed people relative to the labour force.
Types of Unemployment:
Frictional Unemployment: this is unemployment that results from people who are “between jobs”, e.g. a teacher who loses his job in May and who will start teaching in a new school in September is said to be ‘frictionally’ unemployed for three months. A second example of frictional unemployment is where a builder in Cavan is laid off due to lack of work, yet there may well be work available in Dublin.
Structural Unemployment: this occurs where there are changes in the structure of industry resulting in a mismatch between the skills of jobseekers and the jobs that are available. An example would be where builders have no work yet cannot ‘retro-fit’ houses with new thermal insulation as they do not have the required expertise.
Seasonal Unemployment: this is unemployment that results from a change in the time of year, e.g. a hotel worker may find themselves unemployed during the winter months.
Institutional unemployment: this arises from obstacles preventing the mobility of labour, e.g. lack of housing.
Causes of unemployment:
Frictions in the labour market.
Lack of skilled workers.
Improvements in technology.
Seasonal factors.
Recession.
Relocation of industry.
A systematic crisis.
Uncertainty about the future.
A change in the structure of society.
Measuring unemployment:
The main methods in Ireland for measuring our unemployment rate:
The Live Register: this is a record of all those in receipt of social welfare payments.
The Quarterly National Household Survey (QHNS): this is a survey of 39,000 households carried out every quarter and the employment status of those surveyed is used as an indication of the national unemployment rate.
The Labour Force Survey: the LFS is a large-scale national survey of households in Ireland. Each quarter this survey produces data on unemployment, employment, labour force participation and occupation as well as sectoral, demographic and geographic breakdowns.
Investigating the data for insights:
The Live Register is signed by everybody receiving an unemployment-related welfare payment. However, some of these people may be in employment while legally receiving social welfare payments as part of a scheme, e.g. the back-to-work allowance. This results in a larger unemployment figure than the QHNS.
Some people work on the ‘black’ or even ‘grey’ economy while illegally claiming social welfare payments. This again means that the Live Register figure will be larger than the QHNS figure.
By definition, an unemployed person must be available for and actively seeking work. Some people who are on the dole have no interest in finding work, yet, they still add to the Live Register figure.
In rare cases, someone could find themselves unemployed yet not want the bother of applying for social welfare. Such a person would show up on the QHNS.
What is the impact of unemployment on the economy?
A decrease in consumer demand
Deflation
Less investment
A budget deficit due to higher social welfare payments
A budget deficit due to lower tax receipts
Increased burden of taxation on the employed
More social problems and increased crime
Downward pressure on wages
Less demand for imports.
What are the strategies for reducing unemployment in Ireland?
Encourage entrepreneurship
Decrease taxation
Keep the rate of corporation tax low
Subsidise additional labour
Reduce costs for business
Invest in education and training
Encourage greater consumption of Irish goods.
Strand 4 .4 Monetary policy and the price level.
The Consumer Price Index and Inflation.
Inflation occurs when there is a rise in the general price level. It results in a fall in the purchasing power of money. This video explains the effect of the rate of inflation on the purchasing power of money.
Causes of Inflation:
1. Demand-pull inflation:
Demand-pull inflation occurs when demand for goods and services is greater than the supply of goods and services, thereby forcing prices to rise. Demand-pull inflation can be caused by:
Increased incomes: higher incomes lead to increased demand which ‘pulls’ prices up.
Decreased direct taxes: as tax levels fall disposable incomes rise leading to demand-pull inflation.
Increased government spending: by spending more money the government can fuel demand-pull inflation.
Low interest rates: as we saw during the ‘boom’ low interest rates led to increased spending which in turn ‘pulled’ prices up.
2. Cost Push Inflation:
Cost-push inflation occurs when the cost of providing goods and services rises and producers pass these increases on to the consumer in the form of higher prices. Examples of this include:
Increased labour costs: this happened during the ‘boom’ when wage agreements gave workers significant pay awards which had to be paid for in higher prices for the output of workers.
Increased energy costs: as oil, electricity and gas increase in price there is upward pressure on inflation.
Increases in the price of raw materials: if the price of oil increases, users of oil like airlines are likely to ‘push’ their prices up.
3. Indirect Taxation by the Government / Government induced inflation:
Indirect taxes like VAT and excise duty 'push' prices up, thus raising inflation.
4. Imported Inflation:
If imported raw materials increase in price, this contributes to inflation.
5. Increased Borrowing / Increased Lending by the Banks / Low Interest Rates:
As we saw during the ‘boom’ money was much more easily available, therefore, as the Taoiseach said in Davos, “Irish people went mad borrowing”. This push prices up as there was now much more money chasing the same number of goods.
6. High Interest Rates:
In one sense high interest rates actually help lower inflation, however, as mortgage repayments are included in the CPI, high rates actually raise the level of inflation.
Economic Effects of Inflation:
The effects of high inflation are as follows:
Purchasing power of money falls – in extreme cases money becomes worthless.
Workers demand pay rises – in order to ‘keep pace’ with inflation.
People on fixed incomes suffer a lowering of living standards – a fixed salary, or a pension, is worth less in a period of high inflation.
Savings decrease in value.
Irish exports become less competitive.
Employment may fall – as businesses become less competitive.
The ECB may raise interest rates – in order to lower inflation.
Government spending may rise – they may be forced to raise social welfare to ‘keep pace’ with inflation.
Imports may rise – to replace more expensive domestic alternatives.
Inflation causes a wealth transfer from the poor to the rich:
As less well-off people tend to hold their wealth in cash rather than in assets, consistently high inflation will erode the purchasing power of their wealth. However as better-off people tend to hold their wealth in assets e.g. houses, high inflation will push wages up stimulating demand for property thereby appreciating its value. This video explains how that happens.
In this video, I explain how a relatively low rate of inflation masks the true erosion of the purchasing power of your money.
What is deflation:
This is when there is a general decrease in the average level of prices. A critical component of deflation is “deflation psychology” which occurs when people expect prices to fall and therefore reduce their demand. This has the effect of reducing prices, i.e. deflation. The more that this happens the greater the level of deflation, which is very damaging to the economy in the long term.
The Role of Government in Reducing Inflation:
While the government has the ability to curb inflation, its powers are limited, for example, it can do very little about the price of oil, nor can it raise interest rates as these are controlled by the ECB. What can it do?
Decrease indirect taxes: While the government cannot control the price of oil, it can reduce the amount of VAT it charges on petrol and diesel.
Increase income tax: By leaving workers with less disposable income there would be less upward pressure on inflation.
Negotiate with the social partners: If the trade unions could be got to accept wage restraint there would again be less pressure on inflation.
Measuring Inflation:
The Consumer Price Index is used to measure the general increase in the price of goods and services in Ireland. The CSO employs 200 people in 86 villages, towns and cities around Ireland. On the second Tuesday of every month 613 items are priced. Over 50,000 price quotes are received in total each month as well as replies to around 3,000 postal and telephone interviews. The items surveyed and the weights attached to each good are determined once every five years in a Household Budget Survey. This is to ensure that goods people no longer buy, e.g. video tapes, are no longer counted, and that goods that are now compulsory, e.g. child-seats, are given an appropriate weight.
Constructing a Composite Price Index:
A base year is selected and assigned an index of 100. The basket of goods priced in the base year is used for comparison with subsequent years. Click here for a short video on the relevant calculations.
Weights (percentage of income) are assigned to the goods.
A simple price index is constructed using the following formula:
Price in current year x 100
Price in base year 1
The simple index for each good is multiplied by its weight.
The results are added up to a final index for the current year which can be easily compared to the base year. This video answers a typical exam question on the calculation of the CPI.
Limitations of the CPI:
The CPI does not account for a change in the quality of the good, i.e. a price increase may be due to the improved quality of the good.
New products are not included. Weights are assigned in a Household Budget Survey once every 5 years. Goods developed after the survey will not be included until a subsequent one, five years later.
The quality of goods is not reflected in the CPI. In other words a good may have increased in price by a little but in quality by a lot.
Weights are calculated in the base year, which means that changes in spending patterns from one year to the next are not accounted for.
The CPI is based on average spending, however, there is no such thing as the average consumer. A teacher living and working in Dublin may spend 1% of his income getting to work each year, whereas a teacher living in Lacken but teaching in Navan could spend 15% on travel.
Who uses the CPI?
Employees and trade unions use the CPI figures when negotiating pay claims.
Social welfare recipients. The CPI can be used to index-link social welfare payments so that they keep pace with inflation.
Consumers.
People with savings are anxious about the real value (purchasing power) of their deposits. The CPI will enable them to establish the real rate of interest (i.e. the rate of interest minus the rate of inflation).
Exporters are affected by inflation also.
Other composite price indices:
A Constant Tax Price Index: A CTPI is one that omits price increases due to increases in indirect taxes when compiling the CPI.
The EU Harmonised Index of Consumer Prices (HICP): This allows comparisons to be made across member states.
The Agricultural Output Price Index: This tracks changes in prices in agricultural outputs like feeding, fertiliser and seeds.
The role of the Central Bank:
The role of the Central Bank is to maintain price suitability. It achieves this aim through monetary policy, which is the managing of the amount of money in the economy. It can do this in a number of ways:
Open market operations
Quantitative easing
Altering the reserve:deposit ratio
Altering the interest rate it charges to the commercial banks.
The European Central Bank:
The European Central Bank is the Central Bank of the 19 EU countries that have adopted the euro. It’s main task is to maintain price stability in the Euro area. It also has the following responsibilities:
Sole issuer of banknotes and bank reserves in the Euro area. The national Central Banks are responsible for actually printing and distributing the notes but they are part of the Eurosystem together with the European Central Bank.
The ECB communicates the monetary policy stance to the media, the markets, the banks and society.
The ECB aims to ensure that the money market operates in a smooth manner by providing money to banks and other financial institutions as and when needed.
How does the ECB implement monetary policy within the Eurozone?
The ECB monitors the growth of the money supply to ensure the euro maintains its value.
The ECB engages in open-market operations in order to increase (quantitative easing) or decrease (issuing bonds) the amount of money in circulation.
It requires credit institutions in the Eurozone to hold deposits on account with their national central banks. These are known as minimum or required reserves.
The ECB uses standing facilities like the Marginal Lending Facility (the facility to borrow money from the ECB) and the Deposit Facility (the facility to make overnight deposits with the ECB).
The ECB and Ireland:
As a member of the Eurosystem, Ireland contributes to ECB monetary policy. The governor of the Irish Central Bank is a member of the ECB governing council. ECB monetary policy can affect the euro exchange rate which in turn affects the country's balance of trade and balance of payments. If there is a banking crisis, the ECB can provide emergency liquidity to banks
The Central Bank of Ireland has the following functions:
Eurosystem Effectiveness and Price Stability: The Central Bank is responsible for contributing to the formulation of Eurosystem monetary policy and helping to ensure that the Euro area inflation objective is achieved. It supports the Governor in his role as a member of the Governing Council of the European Central Bank (ECB). The primary objective of the ECB's monetary policy is to maintain price stability. In this pursuit, the ECB aims to maintain inflation rates below, but close to, 2% over the medium term.
Stability of the Financial System: The Central Bank has an explicit mandate in domestic and European legislation to contribute to financial stability in Ireland and at euro area and EU levels. It does so by enhancing the macro-prudential policy framework by further developing a suite of indicators to assess systemic risks, developing macro-prudential tools to address emerging risks, conducting analytical research to inform on the calibration of these tools, and evaluating the effectiveness of these tools in limiting systemic risk. The Central Bank is also mandated to establish and operate a Central Credit Register which will document loans to individuals and businesses. This will enhance the Central Bank's insight into credit information. When operational, all lenders will be required to submit personal and credit information on loan agreements of €500 or more to the Register.
Protection of Consumer of Financial Services: As the regulator of financial service providers and markets in Ireland, the Central Bank has to ensure that the best interests of consumers are protected. The Central Bank works to develop a positive consumer focused culture within regulated firms, ensuring the consumer protection framework remains effective by reviewing, developing and enhancing the protections in place and by influencing and shaping European and international developments, and monitoring and enforcing compliance with the required standards through themed reviews and inspections.
Regulation of Financial Institutions and Enforcement Actions: The Central Bank aims to ensure that regulated firms are financially sound and safely managed. Regulation of financial institutions and markets is undertaken through risk-based supervision, which is underpinned by credible enforcement deterrents. This mandate is delivered through a range of tools which include supervising banks within the Single Supervisory Mechanism framework, monitoring of regulatory returns filed with the Central Bank, approval of persons under the fitness and probity standards, and taking enforcement actions when necessary. The Central Bank aims to take a proportionate approach to its actions as an intrusive and assertive regulator and does not seek to ensure a ‘zero-failure’ system of regulation and supervision, but to safeguard that any firms that fail, do so in a way that avoids significant disruption to financial services or consumers.
Regulatory Policy Development: A high quality and effective regulatory framework is essential in requiring financial firms to operate to high standards as it provides the basis for supervising and enforcing the key principles of organisational and financial soundness, consumer protection, and effectively functioning markets. The Central Bank engages actively in the European regulatory policy process, contributing to the development of sound rules well adapted to the Irish context and supporting the work to transpose those rules into Irish law and provide the framework for their application to Irish financial firms and markets.
Efficient and Effective Payment and Settlement Systems and Currency Services: The Central Bank, in conjunction with the ECB and other national competent authorities, is responsible for ensuring that payment, settlement, and currency systems are safe, resilient and efficient and that access to such systems is not restricted. The Central Bank also ensures the provision of banknotes and coins and other related currency services to the public, a key component of payments systems.
Independent Economic Advice and High Quality Financial Statistics: The Central Bank aims to ensure that its economic advice is forward looking and independent and that statistics are robust and relevant. To achieve this, the Central Bank undertakes data collection, statistical analysis, economic analysis and research designed to inform economic policy making domestically and at the euro area level. The analytical and statistical outputs are disseminated through various publications, seminars and through ongoing interactions with government departments, academia and commentators.
Recovery and Resolution of Financial Institutions: The Central Bank aims to develop a robust framework in place to ensure that failed or failing regulated firms go through an orderly resolution. The Central Bank requires all banks and investment firms within scope to prepare recovery plans, which set down the measures they would adopt in the event of their financial deterioration. The Central Bank then puts feasible and credible resolution plans in place for those firms.
Changes in the demand for and supply of money:
Inflation: If there is more money chasing goods, their price will inevitably rise.
Imports: More money in circulation means peoples MPM’s increase. Imports tend to be luxury goods.
Fall in exchange rate: An increase in the demand for imports will reduce the value of the euro.
Interest rates: The greater the supply of money, the more likely interest rates (the price of money) are to fall.
If the supply of money grows slower than the production of goods and services, then the following might happen:
Deflation: the average price of goods will fall due to less money chasing them.
Unemployment: with less money available in the economy, aggregate demand will fall resulting in jobs losses.
Imports: there will be less demand for imports.
Increase in the rate of exchange: with less demand for imports, the value of the euro relative to other currencies will increase.
Interest rates: if the supply of money contracts, then the interest rate (the price of money) may increase.
Strand 4.5: The Financial Sector.
The financial sector is the engine of an economy. An understanding of its workings is vital to a clear appreciation of the difficulties and challenges faced by a modern open economy such as Ireland.
Financial markets:
Money markets: these provide short-term finance to banks, companies, governments and individuals.
Capital markets: these provide medium and long-term finance. Governments raise finance by selling bonds, while firms sell stock.
Foreign exchange markets: these are split into two: (i) Spot markets which is for transactions that occur now, and (ii) Forward markets which are for transactions that will happen at an agreed time in the future. On this market contracts (called ‘futures’) are made at a price agreed today but for future delivery. While firms can lose out if the exchange rate changes, futures allow for better planning.
The supply of money in a modern economy and financial system is determined by three key factors:
“Open market operations” – this is effectively the same as Quantitative Easing. The Central Bank buys government bonds, effectively creating money
The “reserve requirement” imposed on banks – this is the % of deposits made by customers at the bank that the bank must keep hold of rather than lending it out
The policy interest rate set by the central bank – the rate of interest will influence how many households and businesses are willing and able to borrow. Most money in a modern economy is created by commercial bank lending so the rate of interest ultimately does have a bearing on the supply of money
Key factors affecting the demand for money
The rate of interest on loans
The number / value of monetary transactions that we expect to carry out
The extent to which we also want to hold other financial assets, such as bonds, property, saving (this is also influenced by the rate of interest) – this is known as the speculative motive for holding money
Changes in GDP
The extent to which it is possible to use debit cards / credit cards i.e. the pace of financial innovation
The extent to which we might have to pay out large unexpected payments, for example, for i.e. the precautionary motive
The rate of anticipated inflation
The rate of interest:
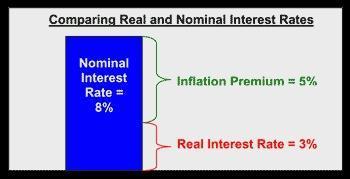
This is the price borrowers pay for funds, and the price savers get for offering their funds to borrowers. The nominal interest rate (or money interest rate) is the percentage increase in money you pay the lender for the use of the money you borrowed. For instance, imagine that you borrowed €100 from your bank one year ago at 8% interest on your loan. When you repay the loan, you must repay the €100 you borrowed plus €8 in interest—a total of €108.
But the nominal interest rate doesn’t take inflation into account. In other words, it is unadjusted for inflation. To continue our scenario, suppose on your way to the bank a newspaper headline caught your eye stating: “Inflation at 5% This Year!” Inflation is a rise in the general price level. A 5% inflation rate means that an average basket of goods you purchased this year is 5% more expensive when compared to last year. This leads to the concept of the real, or inflation-adjusted, interest rate. The real interest rate measures the percentage increase in purchasing power the lender receives when the borrower repays the loan with interest.. In our earlier example, the lender earned 8% or €8 on the €100 loan. However, because inflation was 5% over the same time period, the lender actually earned only 3% in real purchasing power or €3 on the €100 loan.
I recommend you listen to this short podcast on the concept of collateral.
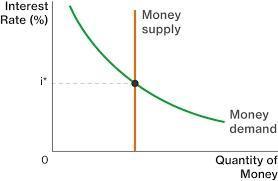
The diagram below illustrates where the supply of money and the demand for money intersect, and we end up with the equilibrium rate of interest.
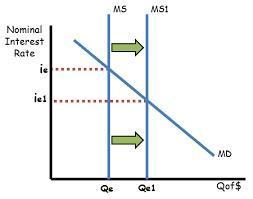
The next diagram shows what happens when the money supply increases causing the rate of interest to fall:
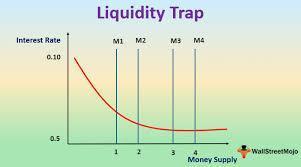
The Liquidity Trap:
A situation can arise where the money supply increases and has no effect on the rate of interest. This would occur where interest rates were already very low and people were holding all their extra money in liquid form. The demand curve in this situation is nearly perfectly elastic and an increase in the money supply does not lead to a fall in interest rates but rather an increased demand for imports and demand pull inflation.
How do changes in the rate of interest impact economic activity?
Borrowing is discouraged/encouraged
Savings are encouraged/discouraged
Improved/disimproved competitiveness
More/less incentive to invest
Economic growth/negative growth
More/less revenue from DIRT
What is the role of financial markets?
To facilitate saving by businesses and households: Offering a secure place to store money and earn interest
To lend to businesses and individuals: Financial markets provide an intermediary between savers and borrowers
To allocate funds to productive uses: Financial markets allocate capital to where the risk-adjusted rate of return is highest
To facilitate the final exchange of goods and services such as contactless payments systems, foreign exchange etc.
To provide forward markets in currencies and commodities: Forward markets allow agents to insure against price volatility
To provide a market for equities: Allowing businesses to raise fresh equity to fund their capital investment and expansion
Financial institutions that operate in Ireland:
Broker: a regulated firm that receives and processes orders in financial products, e.g insurance.
Bureau de change: involves the buying or selling of foreign currency.
Credit institution: any business that takes in deposits and administers credit, e.g. a bank.
Credit union: a cooperative that enables members to save and offers them credit for the mutual benefit of members.
Debt management agency: a company that gives advice to businesses about discharging their debts and negotiates with creditors.
Electronic money institution: is authorised to issue e-money.
Fund managers: a business that pools the money of investors to further invest in stocks and bonds.
Funds service provider: a business that provides services to a fund manager.
Home reversion firm: works with people who want to sell a share of their home.
Insurance providers.
Money transmission businesses: these offer methods of transferring money from one person to another, e.g. Revolut.
Moneylender: a business that provides short term loans to people.
Payment institutions: a business that provides payment services to people, e.g. credit or debit cards, mobile payment apps, etc.
Retail credit firm: a business that provides credit in the form of cash loans directly to people.
Securities market: a market where securities are traded.
What is the role of financial institutions?
They make credit available.
They facilitate the smooth transfer of money between people and across the world.
What is the role of the financial regulator?
Ensures the stability of the financial system.
Protects consumer financial services.
Provides independent economic advice.
Some background information on the banking system.
Definition:
Money is anything that is generally accepted by the majority of people in exchange for goods and services. Unusual examples of money include salt, sharks teeth, grain.
Functions of Money:
A means of exchange - money facilitates the buying and selling of goods.
A measure of value - how much is your house worth?
A means of deferred payment which means that credit creation is possible.
A store of wealth - so you know ‘how much’ you’re worth.
Characteristics of Good Money:
It must be instantly recognisable.
It must be portable.
It must be durable.
It must be easily divisible.
It must be scarce.
The Money Supply:
M1 The Narrow Money Supply: This is all the notes and coins in circulation plus all balances in current accounts in all licenced banks in the state.
M2 The Intermediate Money Supply: This is M1 plus deposits with a maturity of up to 2 years, plus deposits redeemable at 3 month’s notice, plus post office and bank deposits.
M3 The Broad Money Supply: This is M2 plus balances in deposit accounts plus borrowings from other credit institutions, less inter-bank balances.
Some Money Market Terms:
Bond Market:
A bond is an IOU issued by a corporation, government, or governmental agency to cover money the bondholder has lent. If you own stock in a company, you are a part owner of the company. As a bondholder, you are a creditor. Returns from bonds are generally lower than stocks; however, they're a much safer investment. The recent turmoil within the E.U. has caused bond yields to increase sharply, meaning that governments must offer a much higher rate in order to entice investors to buy their bonds. To calculate the value of a bond, the following formula must be used:
Original price of bond x Original rate of interest
Rate of interest on new bonds
Debentures:
A promissory note or a corporate bond which (in the US) is backed generally only by the reputation and integrity of the borrower and (in the UK) by the borrower's specific assets. When unsecured, it is called a bare debenture or naked debenture; when secured by a charge on a specific property, it is called a mortgage debenture.
Promissory Note:
Written, signed, unconditional, and unsecured promise by one party (the maker or “promiser”) to another (the payee or promise) that commits the maker to pay a specified sum on demand, or on a fixed or a determinable date. Promissory notes (such as bank or currency notes) are negotiable instruments.
Banking Ratios:
P.L.R. (Primary Liquidity Ratio) is the ratio of cash banks must hold relative to the claims on them, i.e. Reserve : Deposit ratio.
S.L.R. (Secondary Liquidity Ratio) is the ratio of liquid assets held by the banks to claims on them.
This PowerPoint explains the workings of the banking sector, and the creation of credit.
Limitations on the banks’ ability to create credit: (This video explains the creation of credit in a fiduciary system)
The size of its cash deposits
The level of wealth within the economy
Changes in the P.L.R.
E.C.B. or Central Bank guidelines.
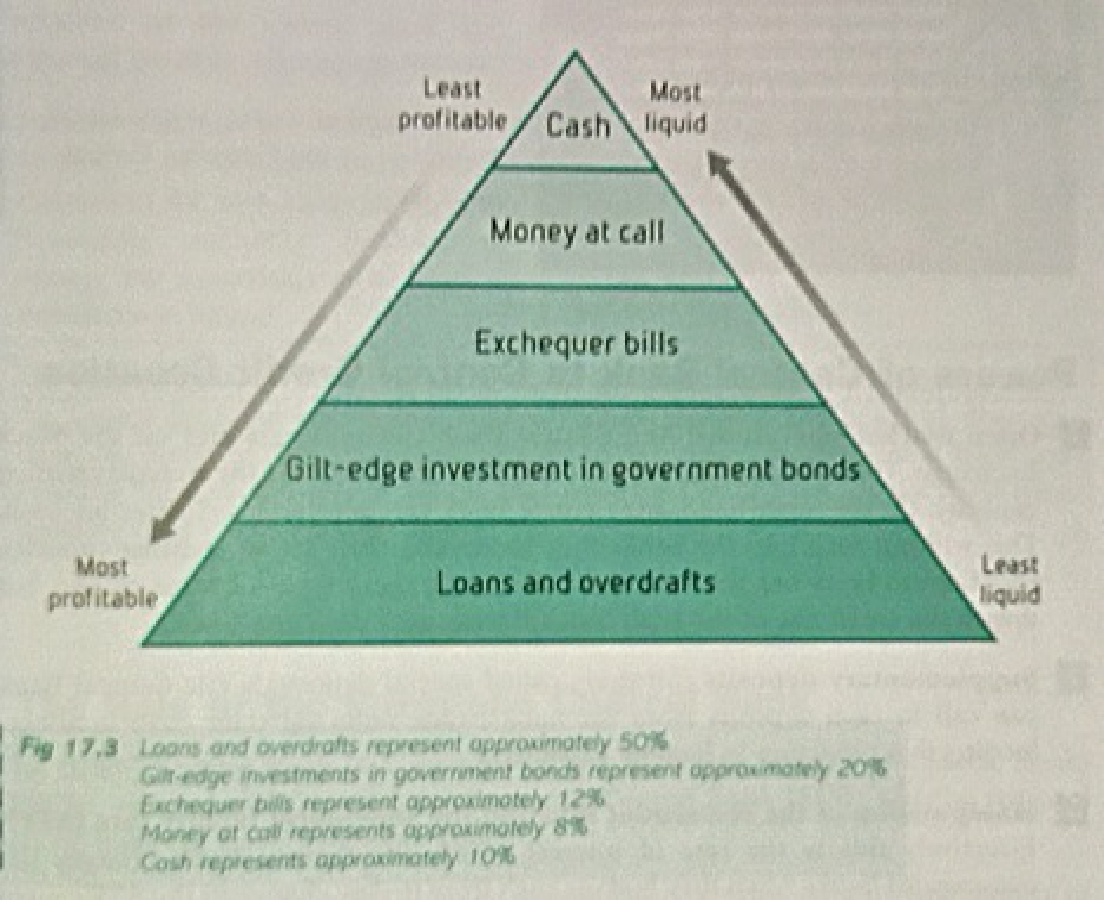
The diagram illustrates the strategy banks adopt to reconcile the conflict between liquidity and profitability.
Note:
the bank retains only a small percentage of liquid assets as these make the least profit for the bank.
Exchequer Bills are 91-day loans to the government at a fixed rate of interest.
This video explains the creation of credit given a Bank Reserve Ratio of 10%.
Monetary Policy: This concerns the amount of money in circulation. It is determined by the ECB and the Irish Central Bank.
Powers of the Central Bank to control credit creation:
Open Market Operations: The Central bank can reduce the amount of cash in the banks by selling securities on the Stock Exchange. With less cash in reserve, the banks cannot loan out as much. Alternatively, by buying securities the Central Bank can increase the cash reserves of the banks, thereby increasing their power to create credit.
Supplementary Deposits: The Central Bank can force the commercial banks to increase their deposits with them thereby decreasing their ability to create credit.
Manipulation of the Rediscount Rate and the Short-Term Facility Rate (STF): This involves an increase in the rate of interest charged by the Central Bank to the commercial banks. Higher interest rates for the banks mean higher rates for customers which means less credit is likely to be created.
Foreign Exchange Swaps: Temporarily swapping foreign exchange for euros increases the commercial banks’ ability to create credit.
Altering the P.L.R.: The Central Bank could force the commercial banks to hold more in reserve thus reducing their ability to create credit.
Advice/Directives: The Central Bank can advise/order the commercial banks to curb their lending practices.
The Role of the E.C.B.:
To maintain price stability and control inflation within the Eurozone.
Its Governing Council comprises the Executive Board (a president assisted by a full-time board) plus the governors of the Eurozone Central Banks. This body formulates monetary policy which is implemented by the Executive Board in conjunction with the Central Banks.
Monetary Policy Instruments:
Main refinancing operations (MRO’s): These are open market operations involving the banks.
The Marginal Lending Facility: This allows banks to borrow money overnight at the STF rate.
The Deposit Facility: Allows banks to make overnight deposits and the interest received becomes the basis for all deposit rates, aka the ‘base rate’ or the ‘ECB rate’.
Minimum Reserve Requirements: This lays down the minimum deposit all banks must have with their national Central Banks.
Responsibilities of the Irish Central Bank:
Maintaining Price Stability: Low inflation is key to growth in an economy.
Ensuring Safe and Reliable Payment Systems: This ensures the smooth transfer of funds between Eurozone economies.
Producing and Distributing Euro currency: The Irish Central Bank is responsible for maintaining the general quality of Euro currency in Ireland.
Managing Foreign Exchange Assets.
Providing advice on Irish Economic policies: The Central Bank advises the government.
Serving the public interest: It is accountable to the Irish public through the Oireachtas.
The Central Bank is the ‘Bankers Bank’ and the Government’s Bank.
The Rate of Exchange of a Currency:
Six factors determine the rate of exchange of a currency:
The Purchasing Power Parity Theory: This theory states that in a free market situation, the internal purchasing power of a currency will equal the external purchasing power.
The Balance of Payments: The demand for a country’s currency is affected by the demand for its exports and also by its demand for imports (which can only be bought using the currency of that country).
The Role of Speculators: People who buy and sell currencies on a large scale have a direct influence on the rate of exchange in the same way as demand for any product affects its price.
The Role of Multinational Companies: Companies operating in many different countries can have an effect on the rate of exchange in a similar way to point 2 above.
Intervention by Central Banks: Any country’s Central Bank can use its own foreign currency reserves to buy up quantities of its own currency in order to shore up its value. It can also sell its own currency in order to devalue it.
International Agreements: Some countries “tie” the value of their currency to another more stable currency. For example, the Irish ‘punt’ was linked to the British pound between 1921 and 1979 (foundation of the E.M.S.) Argentina used to have their currency linked to the US dollar. In Zimbabwe, the US dollar has replaced the Zimbabwean dollar as legal tender since 2011. Inflation by that point had reached over 11,000,000%.
Fixed and Floating Exchange Rates:
A fixed exchange rate is one where the respective values of currencies are set at an agreed level and cannot deviate from that. Governments must take whatever action is necessary to maintain the rate of exchange.
Advantages:
Elimination of Risk/Uncertainty: Fluctuating exchange rates put pressure on importers especially when they decrease significantly, i.e. imports become much dearer.
Speculation is pointless: There is no point buying a foreign currency expecting to make a profit when the rate of exchange changes if rates are fixed.
Disadvantages:
Pressure on Governments: Maintaining the rate of exchange can put governments under pressure to introduce unpopular austerity measures.
Depletion of Foreign Reserves: Central Banks may be forced to spend large quantities of the foreign reserves shoring up the value of a currency under pressure.
Floating Exchange Rates:
Under this system, currencies find their own values relative to one another through the interaction of supply and demand.
Advantages:
Currencies will find a level appropriate to the state of their economy: If a currency needs to be weakened in order to make exports more attractive, this can easily be done using the central Bank intervention mentioned above.
Balance of payments equilibrium can be achieved: If a country’s exports are less than its imports, the value of its currency will go down, thereby making exports cheaper and imports more expensive.
Disadvantages:
Uncertainty: Countries may become less likely to engage in foreign trade if the rate of exchange is very uncertain.
Borrowing would be less likely: Countries again would be less likely to borrow for the same reason.
Speculation is profitable: This has the effect of making it more likely which increases uncertainty in the market.
Effects of the introduction of the Euro on the Irish Economy:
Foreign travel became easier, both into and out of the country.
Inflation: When the euro was introduced some prices were “rounded up”, e.g. €3.87 quickly became €3.99.
Price comparisons became much easier.
Much greater choice of financial products as consumers were now able to apply for financial products from any Eurozone country.
Prudent management of the economy: Membership of the single currency has forced the government to maintain tighter controls over things like the Debt/GDP ratio. However, with the financial collapse, most of these restrictions have now been lifted.
Low rates of interest: ECB interest rates have always been low (1% in Dec. 2011, 0.05% in 2016) which has benefitted the Irish consumer. Ironically, this has led to the financial collapse as consumers acquired unsustainable levels of personal debt.
Benefits to businesses:
Exchange risk has been eliminated.
It is easier to pay for goods.
Low interest rates.
Increased trade opportunities.
Effects on the Government:
The government has lost the ability to manipulate exchange rates.
Some loss of sovereignty (total loss since 2008, although we have regained control of our budgets since Jan. 2014).
Loss of direct control over national monetary and budgetary policies.
33% of our imports and 25% of our exports are with the UK.
Now that you've finished this strand, why not test yourself on these notes.