Click here to have these notes read to you (Chrome).
Strand 1.1 Economics as a way of thinking.
Economics is a social science. The basic principle underlying the study of economics is the concept of scarcity, or the perception of scarcity.
Some of the basic terms include:
Opportunity cost is the cost of one option in terms of the next best option available. The opportunity cost of you coming to school might be the sleep-in that you now cannot have, or it could be a part-time job that you cannot attend. Click the link to listen to a short podcast on the concept of Opportunity Cost.
Externalities are the unintended side effects of a calculated decision to do something. This is also called “the law of unintended consequences”. Click the link to listen to a podcast on the concept of Externalities.
Wealth and Income: Wealth is the one’s stock of assets, whereas income is one’s earnings. One might be said to be a millionaire and yet have a very modest income.
Needs and wants: a need is what is necessary for survival, e.g. food and shelter, whereas a want is a luxury item, e.g. a holiday.
Assumptions are sensible guesses made by economists based on their observations and knowledge.
Anchoring behaviour: Anchoring is an irrational bias towards an arbitrary benchmark figure. This benchmark then skews decision-making by market participants, such as when to sell the investment.
Paradox of choice: The paradox of choice refers to the phenomenon where an abundance of options available for selection can lead to decision-making difficulties, dissatisfaction, and even a sense of paralysis. This paradox suggests that while having more choices seems desirable, excessive options can overwhelm individuals, making it harder to make a decision and often resulting in less satisfaction with the chosen outcome.
Aims of Economics:
To achieve the efficient use of scarce resources
To achieve an equitable distribution of wealth
To create a stable society.
Deductive and Inductive reasoning:
Deductive reasoning is reasoning from the general to the particular, e.g. observing a number of incidents then drawing a conclusion from them. (Positive statements)
Inductive reasoning is reasoning from the particular to the general, e.g. if you observe 100 people buying less of an item when its price goes up, you may infer that as price goes up, demand goes down. (Normative statements)
Positive and Normative Statements:
A positive statement (click here to listen to a short explanation of this concept ) says what is (the result of deductive reasoning), and a normative statement says what ought to be or what might be (the result of inductive reasoning).
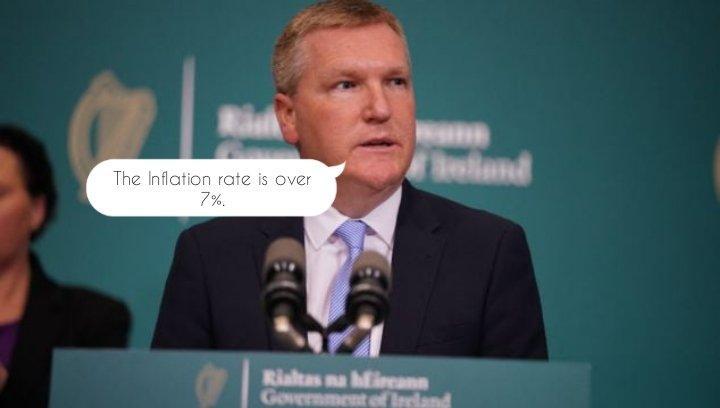
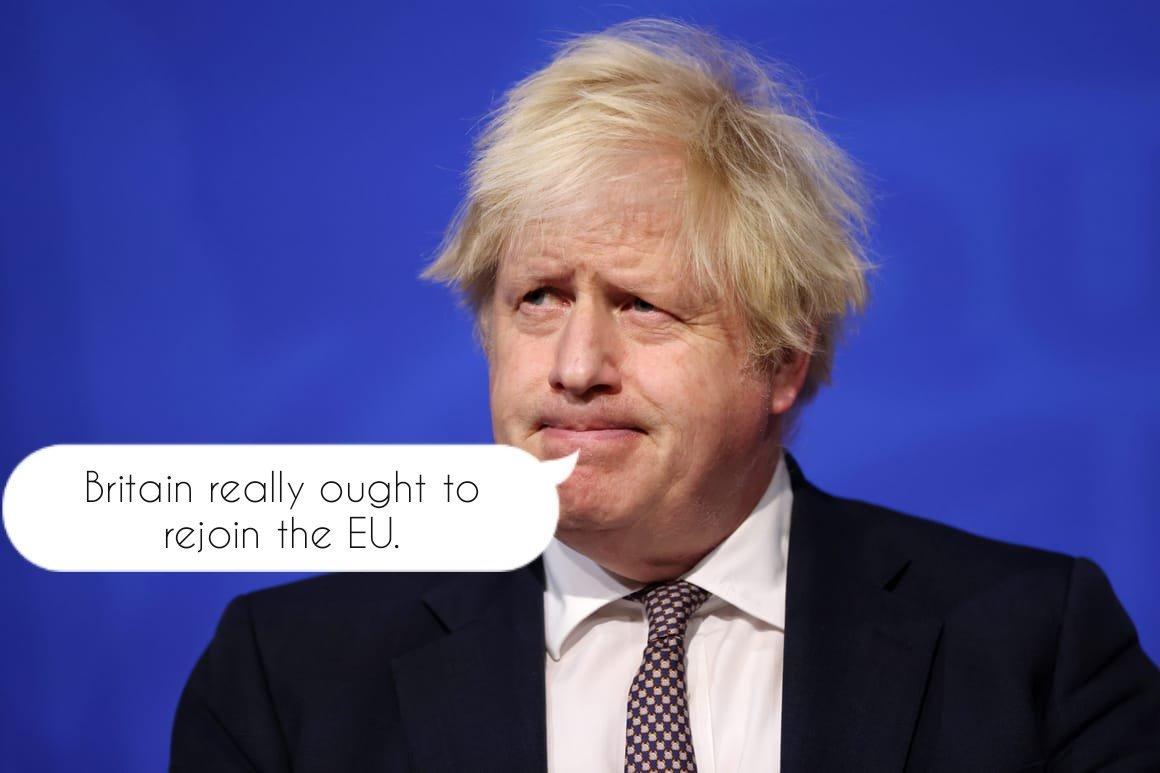
Economists make positive statements about the economy which politicians use to make normative statements about how the economy should be run. Minister McGrath is making a positive statement (which is based on fact), while Mr. Johnson's remark is normative (based on an opinion).
Economic data: Economists must first-of-all establish the situation as it is, i.e. how many people are unemployed, what is the participation rate in a given country, etc. They then use this data in order to make useful decisions about the future, e.g. how will an increase in VAT affect spending?
The scientific method: this involves the analysis of accurately obtained data, and the subsequent extrapolation of a working model from that data. The model must then be tested to establish its relevance to the problem.
Nominal versus real values: this is the difference between figures given (nominal) and their actual meaning (real). As an example, if I earn $100 a week when the cost of living is $80 a week and my wage increases to $200 a week you might say I am now nominally twice as well off. However, if my cost of living increases to $220 a week, I am now worse off in real terms.
Calculating the percentage difference between two figures:
This is very important to your analysis of economic data. The difference between 30 and 40 can be either 33.33% or 25.00%. It depends on which figure came first. Watch this short video for more detail.
Who collects the data?
The chief source of economic data in Ireland is the Central Statistics Office (CSO). This data is collected in a number of ways, viz. Questionnaires, online surveys, observations, data collection etc. It is useful at this point to consider appropriate methods of presenting data, e.g. bar-charts, pie charts, pictograms, etc.
You must then interpret the data and derive certain laws or construct certain models from it. Models can be either visual, or mathematical. If for example it is observed that the refectory sells 150 more dinners on a Thursday when the price is lowered by 50%, it can be stated that a similar increase in sales will take place on a Monday if a similar price reduction is implemented. However, this may not happen. Economics is not an exact science. It deals with people, and people are unpredictable.
Manipulation of data:
By altering the length of the y-axis, it is possible to make entirely different points using the same sata. This video explains the point in more detail.
Are consumers rational?
We assume that all the decisions we make are carefully considered and sensible. However, this is probably not always the case. We might buy the reasonably priced jacket instead of the more fashionable one but ten minutes later give in to craving for an ice-cream cone with zero nutritional value. Our spending habits are influenced by many things, peer pressure, habit, incomplete information, instinct etc. We are sometimes the victims of the paradox of choice, where we are simply overwhelmed by the sheer array of choice on offer and just go for the first thing we see.
What is utility?
The concept of utility is one of the most important to economics. Utility refers to the satisfaction we derive from the consumption of a particular good or service. It is measured in utils and is perfectly subjective. That is to say that the utility I derive from eating an ice-cream cone is different to the utility anyone in this class might enjoy. A rational consumer ought to consider utility when spending their money. They should also try to ensure that the utility to euro ratio is similar for all goods bought, e.g. if I get 10 utils of satisfaction from eating an ice-cream costing $1, I should be getting c.100 utils from an item costing $10. This podcast will explain the concept in more detail.
Key economic events:
On October 29, 1929, Black Tuesday hit Wall Street as investors traded some 16 million shares on the New York Stock Exchange in a single day. Billions of dollars were lost, wiping out thousands of investors. In the aftermath of Black Tuesday, America and the rest of the industrialized world spiraled downward into the Great Depression (1929-39), the deepest and longest-lasting economic downturn in the history of the Western industrialized world up to that time.
During the 1920s, the U.S. stock market underwent rapid expansion, reaching its peak in August 1929, after a period of wild speculation. By then, production had already declined and unemployment had risen, leaving stocks in great excess of their real value. Among the other causes of the eventual market collapse were low wages, the proliferation of debt, a struggling agricultural sector and an excess of large bank loans that could not be liquidated.
Stock prices began to decline in September and early October 1929, and on October 18 the fall began. Panic set in, and on October 24, Black Thursday, a record 12,894,650 shares were traded. Investment companies and leading bankers attempted to stabilize the market by buying up great blocks of stock, producing a moderate rally on Friday. On Monday, however, the storm broke anew, and the market went into free fall. Black Monday was followed by Black Tuesday (October 29), in which stock prices collapsed completely and 16,410,030 shares were traded on the New York Stock Exchange in a single day. Billions of dollars were lost, wiping out thousands of investors, and stock tickers ran hours behind because the machinery could not handle the tremendous volume of trading.
After October 29, 1929, stock prices had nowhere to go but up, so there was considerable recovery during succeeding weeks. Overall, however, prices continued to drop as the United States slumped into the Great Depression, and by 1932 stocks were worth only about 20 percent of their value in the summer of 1929. The stock market crash of 1929 was not the sole cause of the Great Depression, but it did act to accelerate the global economic collapse of which it was also a symptom. By 1933, nearly half of America’s banks had failed, and unemployment was approaching 15 million people, or 30 percent of the workforce.
Relief and reform measures enacted by the administration of President Roosevelt helped lessen the worst effects of the Great Depression; however, the U.S. economy would not fully turn around until after 1939, when World War II revitalised American industry.
This twenty minute podcast explains how the market crashed and the lessons learned from the fiasco.
The notions of crisis, stagnation and despair dominate nearly all the chapters of the history books that deal with the 1950s in Ireland. The reasons are obvious: economic failure and its consequences were regarded as eating away at Irish confidence like a cancer. Half a million people left the country and for much of the decade no one seemed to have an answer as to how to turn things around. Many of the civil-war generation were still in power and appeared incapable of charting a new course, and the promises they had made when young about a prosperous, self-sufficient Ireland with the people firmly rooted in the land had been made a mockery of. Indeed, in 2004, one book characterised the period as Ireland's Lost Decade.
The Celtic Tiger period, during which Ireland caught up on its previously much more prosperous EU neighbours, extended from 1993 to 2001. In those eight years our economy grew at a rate that has no precedent, so far as I am aware, in European history. Since 2001 we have moved ahead of most of our neighbours, to the point where, in per capita purchasing power terms, our national output is now about 10 per cent higher than that of the rest of Western Europe, and about 20 per cent higher than that of the enlarged EU. Throughout the world this achievement has evoked intense interest and curiosity.
Of course, everyone in our State is pleased at our economic performance, for we are all beneficiaries of this extraordinary development. But the question of how and why it happened - issues that have engaged governments and informed opinion worldwide - are rarely asked in the country where this development actually occurred. Great emphasis is rightly placed by economists, and by politicians and business people, upon the role played in economic growth by increases in labour productivity - output per worker. In Ireland between 1993 and 2001, output per worker improved by almost one-half, growing by over 5 per cent a year. Elsewhere in Europe, it increased at only one-third of that rate. Undoubtedly a major factor in this was the arrival in Ireland during that eight-year period of almost 300 new mainly high-tech industrial projects. These increased almost five-fold the value of our manufacturing output, tripled the volume of exports, and, most important of all, virtually quadrupled the reported money value of the average industrial worker's output.
The Great Recession, 2007:
The global recession was first seen in Europe, as Ireland was the first country to fall in a recession from Q2-Q3 2007 – followed by temporary growth in Q4 2007 – and then a two-year-long recession. The Republic of Ireland in the first quarter of 2008 reported a contraction in GDP of 1.5 percent, its first economic contraction since it began reporting by quarter and first recorded contraction since 1983. However, Ireland's Central Statistics Office reported growth in GNP of about 0.8 percent. Ireland's government considers GNP a better measure of the economy. Analysts have predicted Ireland's economy will contract further in the rest of the year. A report from NCB Stockbrokers predicts gross national product will fall by 1 percent in 2008 and by 0.4 percent in 2009 due to a decline in multinationals hit by the global economic slowdown. An economist from NCB said non-residential investment would fall by 5 percent in 2008 and by 12 percent in 2009.
Ireland's GDP saw a contraction in the second quarter by 0.5 percent, making Ireland the first member of the euro-zone to enter a recession. The government is being advised by Merrill Lynch, the American broker that ran out of capital in September 2008. In January 2009 it was forced to nationalise its third largest bank, Anglo Irish Bank and to announce recapitalisation of its top two banks, AIB and Bank of Ireland. In February 2009, the government announced record unemployment levels in the country, with its highest monthly increase in 40 years and 1,500 people being laid off daily. Ireland exited the recession in the 3rd quarter of 2009, posting a 0.3% growth in its economy, due to recent heavy budget cuts by the Irish government. However, although they technically exited recession, the Irish economy still has a lot of hurdles to overcome if it is to return to normality.
What lessons can be learned from these events?
If we are to learn from the mistakes of the past we should:
adopt prudent fiscal policies;
monitor the creation of credit;
prudently manage household debt;
focus on export markets as a source of growth.
Relevant economic theories?
Adam Smith was a classical economist: He wrote the Wealth of Nations in 1776. He argued that labour was the main source of wealth. His ‘Labour Theory of Value’ states that the value of something depended on the amount of labour it can demand in exchange for itself. Smith said that people are motivated by self interest and were led by an “invisible hand”. He advocated free trade. Smith developed the canons of taxation. He favoured the specialisation of labour and advocated perfect competition.
Thomas Robert Malthus developed the Theory on Population and Food Supply and the Iron Law of Wages. The population theory states that as the population in 18th century England was increasing geometrically (1, 2, 4, 8, 16, 32...) the food supply was only increasing arithmetically (1, 2, 3, 4, 5, 6....) Malthus wrote about this in An Essay on the Principle of Population in which he predicted that there would be too many people to feed. This did not happen however, due to improvements in technology which increased the food supply. In addition, population increases were not as big as Malthus thought. The Iron Law of Wages explained why wages would never be able to rise above subsistence level. If wages rose, so too would the population, as workers could then afford larger families. As the population rose, so too would the supply of labour, and wages would fall back to subsistence level again.
David Ricardo wrote Principles of Political Economy and Taxation. He advocated free trade and developed the Law of Comparative Advantage. He also developed a theory of rent, and explained economic rent.
Jean Baptiste Say developed Say’s Law (Law of Markets) which states that supply creates its own demand.
John Stuart Mill advocated government intervention in the economy. He wrote Principles of Political Economy. He approved of taxation to redistribute wealth, and supported the formation of trade unions.
Neoclassical School:
Alfred Marshall wrote Principles of Economics in 1890. He discovered elasticity. He also distinguished between the short run and the long run. He said that in the short run, the value of an item depended on its utility, whereas in the long run, the value of an item depended on its costs of production.
Socialism:
Karl Marx lived at a time when workers had very poor living and working conditions because of capitalism. He wrote The Communist Manifesto (along with Friedrich Engels) in which he outlined that the working classes would grow in numbers, organise themselves, revolt and overthrow the capitalists. The workers would then redistribute the wealth in a new classless communist society.
Keynesian School:
John Maynard Keynes wrote Treatise on Money in 1930 and The General Theory of Employment, Interest and Money in 1936. He said that national income could reach equilibrium without reaching full employment. The classical economists strongly believed in the workings of the free market, and that if there was a recession and high unemployment, wages would simply fall causing the demand for labour to rise which would lead to recovery. Keynes however said that if wages fell, consumption would also fall, and this would lead to further unemployment. Keynes advocated government intervention into the economy to boost demand (fiscal policy). He discovered the multiplier effect of an injection into the economy. He also developed the Theory of Liquidity Preference to explain the determination of interest rates.
John Kenneth Galbraith:
Galbraith criticised the nature of personal and public spending by arguing that people spent lots of money on frivolous things leaving themselves short of necessities in the book, The Affluent Society. He also accused governments of not spending enough on public amenities like playgrounds and parks. Galbraith warned against the political power of some multi-nationals who had more wealth and influence than the governments of the countries in which they operated.
Monetarism:
Monetarist economists support the use of monetary policy to control the economy (unlike Keynes who advocated fiscal policy). He argued that money supply was very important in determining the level of economic activity. By reducing the money supply, inflation would fall and the ability of firms and the government to grant pay rises would also be reduced. With stable inflation, the demand for wage increases moderates. Investment would rise as a result of such stability in prices and costs, resulting in increased employment and output. Monetarists believed in the workings of the free market (like the Classical economists). They opposed government interference in the economy and favoured privatisation. Milton Friedman was the chief monetarist economist. He favoured many of the theories of the Classical economists such as laissez-faire, the free market and perfect competition.
Supply-side economists:
Supply-side economists emphasise the need to keep inflation low by increasing supply. Supply will rise if incentives such as tax cuts are given. The increase in supply therefore leads to more jobs and more taxes for the government. Supply-side economists also advocate privatisation and the deregulation of markets.
Strand 1.2 The economic concepts of scarcity and choice.
Economics is the study of the allocation of scarce resources between competing ends. In Strand 1.1 we looked at the concept of needs versus wants. To satisfy these needs and wants we must now consider the concept of scarce resources.
Renewable and non-renewable resources:
Renewable resources are those that can be replenished, e.g. water, forests. Non-renewable resources are those that cannot be replenished, e.g. oil, coal.
Factors of Production:
Land – any of the gifts of nature, e.g. rivers, forests, land itself, the atmosphere.
Labour - any human effort used in the productive process. This is determined not only by the number of people of working age (between 16 and 65) in an economy but their levels of training and education.
Capital – includes all plant, buildings, transport equipment, and ICT used in the productive process. There are three types of capital:
Fixed Capital: the stock of fixed assets
Working Capital: the stock of partly finished and finished goods.
Social Capital: the stock of capital owned by the community in general, e.g. roads, harbours, railways, airports and schools.
The process of adding to the stock of capital in the economy is known as investment or capital formation. There are also processes known as capital widening and capital deepening. Capital widening involves increasing the amount of capital in line with an increase in the labour force, e.g. if you have 10 workers, each with a laptop and you then hire 5 additional workers, you give each of these a laptop too. This maintains the ratio of capital to labour at 1 : 1. Capital deepening would be where you give all 15 of your workers a mobile phone in addition to their laptops. This would increase the ratio of capital to labour to 2 : 1. Gross investment is the total amount of capital created in an economy in one year.
Net investment is gross investment minus depreciation.
Enterprise – the individual who organises the other factors in an efficient and productive manner.
Economies can be organised as:
Centrally planned, e.g. China;
Free market, e.g. USA;
Mixed, e.g. Ireland.
Indicative Planning:
This is where the government negotiates with the social partners, i.e. trade unions, industry representatives, employer representatives, farming representatives and representatives of the unemployed, to devise strategies like the national wage agreements.
Production Possibility Curve/Frontier:
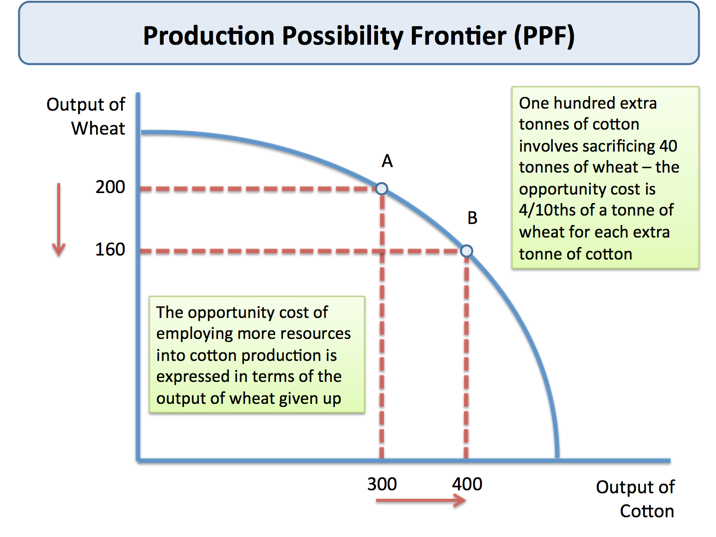
This curve/frontier shows the different combinations of goods that can be produced using the resources available. Some combinations of wheat and cotton can be produced, e.g. 400 tonnes of cotton and 160 tonnes of wheat. However, if more wheat is needed, then the opportunity cost (explained in this short video) is less cotton. This video provides a short explanation of the Production Possibility Frontier (PPF).
This video explains the three possible answers to a Leaving Cert question on the PPF.
Who are the participants in economic activity:
The individual
The business
The government
NGO's (non-government organisations) e.g. Focus Ireland, Show Racism the Red Card, the GAA. A non-governmental organisation (NGO) is an organisation that generally is formed independent from government. They are typically nonprofit entities, and many of them are active in humanitarianism or the social sciences; they can also include clubs and associations that provide services to their members and others.
It is important to note that the interests of one of the above can conflict with one or more of the other participants. Consumers wish to maximise their income and their free time while businesses want to keep costs down and maximise their return from the wages they pay. Governments hope to stimulate economic growth while keeping inflation under control. They want to encourage everyone to work yet maintain decent levels of social welfare payments.
Cost-benefit analysis:
This is a process that considers the various costs and benefits of a particular course of action. You might consider the cost of the economics book against the benefits of studying the subject and conclude that the investment was not worth it. Your money might have given you more utility had you spent the money in another way.
Strand 1.3 Economic, social and environmental sustainability.
What is sustainability?
The 17 sustainable development goals (SDGs) to transform our world:
GOAL 1: No Poverty
GOAL 2: Zero Hunger
GOAL 3: Good Health and Well-being
GOAL 4: Quality Education
GOAL 5: Gender Equality
GOAL 6: Clean Water and Sanitation
GOAL 7: Affordable and Clean Energy
GOAL 8: Decent Work and Economic Growth
GOAL 9: Industry, Innovation and Infrastructure
GOAL 10: Reduced Inequality
GOAL 11: Sustainable Cities and Communities
GOAL 12: Responsible Consumption and Production
GOAL 13: Climate Action
GOAL 14: Life Below Water
GOAL 15: Life on Land
GOAL 16: Peace and Justice Strong Institutions
GOAL 17: Partnerships to achieve the Goal
The main obstacles to the achievement of these SDG's are:
International instability
Co-ordination of governance between states
Converting the goals into relevant local programmes
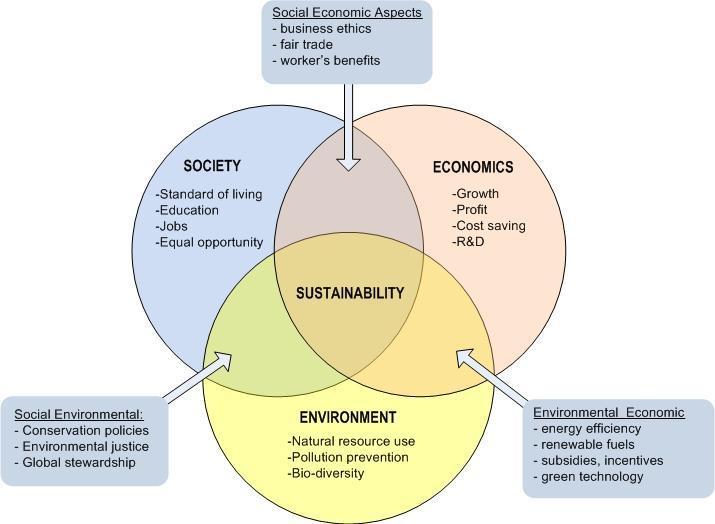
The three pillars of sustainability are:
Social sustainability: the ability of a social system such as the family or a nation to operate indefinitely at a defined level of social well-being and harmony. This concept incorporates things like human rights, environmental law and public participation. Challenges include poverty, injustice and poor levels of education.
Environmental sustainability: Herman Daly, one of the early pioneers of ecological sustainability, looked at the problem from a maintenance of natural capital viewpoint. In 1990 he proposed that:
1. For renewable resources, the rate of harvest should not exceed the rate of regeneration (sustainable yield);
2. For pollution, the rates of waste generation from projects should not exceed the assimilative capacity of the environment (sustainable waste disposal); and
3. For non-renewable resources the depletion of the non-renewable resources should require comparable development of renewable substitutes for that resource.
The list can be shortened into a tight definition. Environmental sustainability is the rate of renewable resource harvest, pollution creation, and non-renewable resource depletion that can be continued indefinitely. If they cannot be continued indefinitely then they are not sustainable.
Economic sustainability: occurs when a political unit, such as a nation, has the preferred percentage of its population below its preferred minimum standard of living level. The percentage needs to be very low, somewhere around 5% or less, because everyone below the level is suffering, either physically due to poor health or psychologically. The poverty threshold or poverty line is defined as “the minimum level of income deemed necessary to achieve an adequate standard of living in a given country.” In poor countries the threshold is defined quite low, as low as $1.25 per day. Below the threshold a person suffers malnutrition and frequently dies. Developed countries define the poverty threshold so much higher that it's no longer a "poverty threshold." It's the preferred minimum standard of living level. For example, in the US it's $30 a day. This is widely called the “national poverty line”. The more accurate term is "preferred minimum standard of living level”.
Resource degradation: Resource degradation is the decline in the quality, functionality, or ecosystem services of natural resources caused by human activities, pollution, or natural processes. It harms economic sectors reliant on these resources, like agriculture, fisheries, and tourism, and demands management to sustain the environment and economy.
Resource depletion: Resource depletion is the gradual, irreversible reduction in the quantity or quality of natural resources, like minerals, fossil fuels, forests, or water sources, due to unsustainable use. It occurs when resource consumption exceeds the natural replenishment rate, posing economic and environmental challenges.
The Rule of 72:
This tells us how long it will take for an economy to double its output. It is stated as 72/g, where g is the annual growth rate in the economy. For example, if the growth rate was 6%, the economy would double its output in 72/6 = 12 years.
How are the three pillars of sustainability connected?
In 1983 the Brundtland Commission looked at these overlapping areas of sustaining life on Earth and suggested that any change in one will disturb the other two. Economic growth has many benefits, but it also comes at a cost to the environment. It is one of the many paradoxes of this subject that continued positive growth in an economy can, over time, actually lower standards of living for citizens.
Indicators of economic growth, social cohesion and inequality, and environmental sustainability:
Economic growth: GDP is the standard measure of economic growth in an economy. It measures the incomes earned by all the citizens of a country. It ignores the externalities that result from years of sustained growth as I mentioned above. The UN introduced the HDI as a better measure of socio-economic well-being. It considers things like life-expectancy, standards of education, and GDP. It is sometimes called the happiness index.
Social cohesion and inequality: Inequality can refer to access to education, discrimination and prejudice in society. It also relates to income inequality. Inequality threatens growth, undermines social fairness and leads to inequality of opportunity. (This might be a good time to consider equality of opportunity vs equality of outcome). Inequality is measured using the S80/S20 share ratio which compares the income of the wealthiest 20% with that of the lowest 20%. A score of 5.0 means that the income of the richest 20% is five times that of the lowest 20%. A score of 1.0 would mean perfect equality of income.
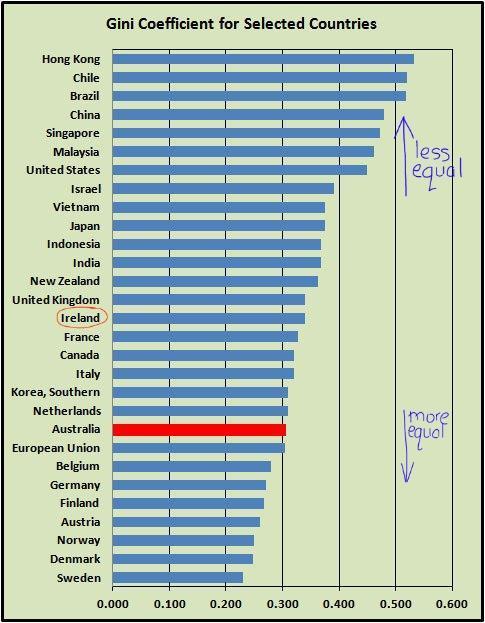
The Gini coefficient: The Gini index or Gini coefficient (click here for more details) is a statistical measure of distribution developed by the Italian statistician Corrado Gini in 1912. It is often used as a gauge of economic inequality measuring income distribution or, less commonly, wealth distribution among a population. The coefficient ranges from 0 (or 0%) to 1 (or 100%), with 0 representing perfect equality and 1 representing perfect inequality. The government can reduce inequality using the following: progressive taxation; social welfare expenditure; spending on health-care and education; minimum wage legislation. It is commonly believed that poverty causes or leads to crime, however it is actually relative poverty which is the problem. This video explains why income distribution is such an important concept in Economics.
Environmental sustainability: The Environmental Performance Index evaluates the environmental performance of a country's policies and has two main components, viz. Environmental health which measures air quality, drinking water and sanitation standards; and Ecosystem vitality which measures waste water treatment, agriculture and nitrogen use, forest cover, fish stocks, biodiversity, habitat, climate and energy.
Another commonly used index is the Global Green Economy Index. It measures leadership and climate change, efficiency sectors, markets and investment, and the environment.
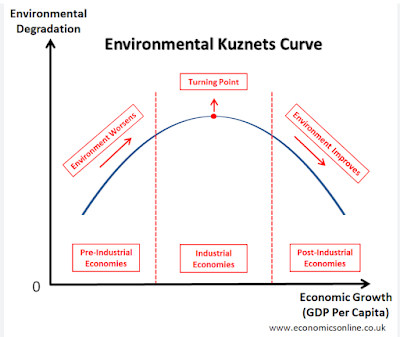
Kuznet's environmental curve is used to graph the idea that as an economy develops, market forces begin to increase and economic inequality decreases. More specifically that as the economy grows, initially the environment suffers but eventually (after the turning point) the relationship between the environment and the society improves.
Sustainable development for individuals, businesses and the government:
Sustainability is the responsibility of all agents of society. We must all act to achieve the goal of sustainability. By changing our own habits and choices we will encourage others to do the same. Businesses will be forced to respond to the changes taking place in the market and governments seeking re-election will also see the need to change their policies.
Sustainability is the responsibility of all agents of society. By changing our own habits and choices we will encourage others to do the same. Businesses will be forced to respond to the changes taking place in the market and governments seeking re-election will also see the need to change their policies.
Now that you've finished this strand, why not test yourself on these notes.