Click here to have these notes read to you (Chrome).
Strand 2.1: The Market Economy.
Utility is the amount of satisfaction we get from consumption. It is measured in utils of satisfaction, which is a theoretical concept.
For a good to be considered an economic good it must:
Give utility/satisfaction
Ownership of it must be transferable from retailer to consumer
Be scarce in relation to the level of demand.
The Paradox of Value states that some goods give massive satisfaction and are transferable yet because they are unlimited in supply are not an economic good and as a result have no value. By contrast other items have very little use, yet due to their scarcity are considered very valuable, e.g. gold.
Assumptions made about consumers:
They act rationally
They have limited incomes
They aim to get maximum utility from money spent
They are subject to the Law of Diminishing Marginal Utility.
Payments to the factors of production:
Land – Rent
Labour – Wages
Capital – Interest
Enterprise – Profit
Transfer payments are those made to individuals for which no factor of production is supplied in return.
Principle of Equi-marginal Utility/Law of Equi-Marginal Returns (click here for a short illustration):
MU/P should be constant for all goods bought. In other words, in order to maximise utility, a consumer must spend his/her income so that the ratio of marginal utility to price is the same for all goods he/she buys.
The consumer is said to be in equilibrium when they follow this principle:

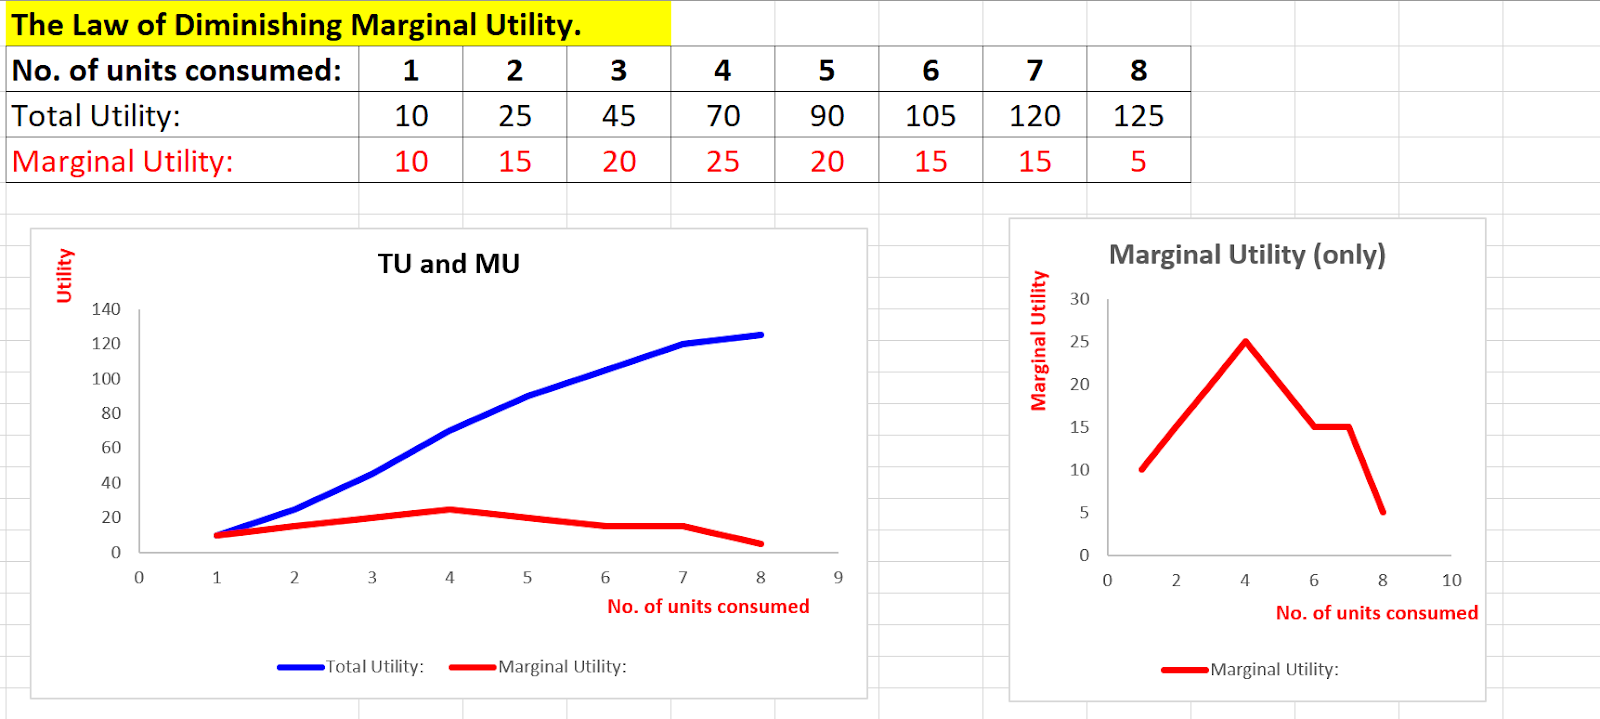
The Law of Diminishing Marginal Utility (click here to view a short video on calculating MU and TU):
The law states that the more of a good a person consumes, the less satisfaction they will gain from each extra unit consumed. This video offers further explanation of the concept.
The graphs below explain the concept behind the LDMU. Watch this video for more analysis.
Types of Markets:
Factor, Intermediate and Final Markets:
Factor Markets are the markets for the factors of production.
Intermediate Markets are where goods are bought in order to have some value added to them.
Final Markets are where finished products are sold.
Examples of markets in operation:
A retail shop
An auction
Haggling
Consumer Surplus (click here to view a short explanation):
This is the difference between what a consumer pays for a good and what they would be prepared to pay rather than go without the good.
Producer’s Surplus.
This is the difference between the lowest price a producer/seller is prepared to accept for their good, and the price they actually receive for their good.
Bargaining Range.
This is the difference between the maximum price the consumer is prepared to pay and the minimum price the seller is prepared to accept.
Demand (click to view a short video)
The Demand function is as follows:
D = f (p, y, t, g, e, u, c, pog) where:
P = price
Y = income
T = taste
G = Government regulations
E = Expectations of the future price of the good
U = Unplanned
C = Availability of credit
POG = the price of other goods, compliments and substitutes.
The Income Effect (how does a change in income affect the Qd of a good):
Normal goods have a positive income effect, i.e. as income goes up, demand for the good also goes up, and vice versa.
Inferior goods have a negative income effect i.e. people will buy less of them as their income increases.
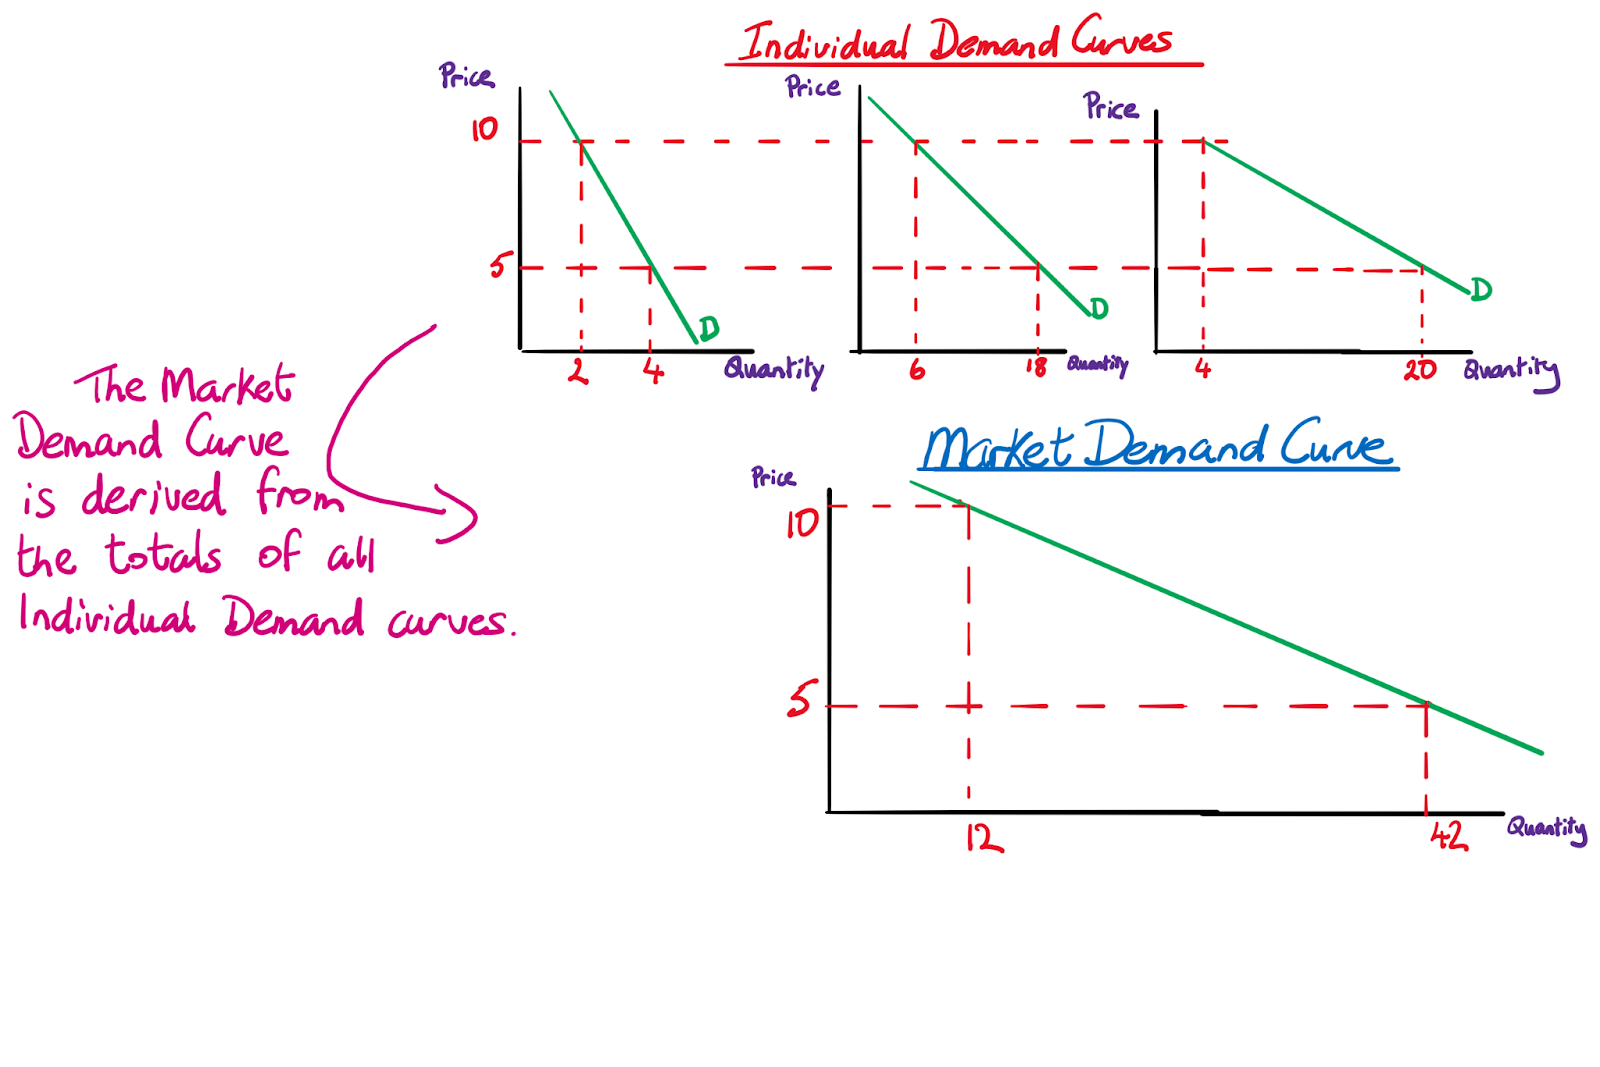
The relationship between individual demand and market demand:
Types of demand curve:
Individual demand curve: where the price/quantity-demanded combinations of an individual are depicted in graphical form.
Market demand / Aggregate demand: this is where the price/quantity-demanded combinations of all consumers in the market are depicted graphically.
Click here to view a short video on the relationship between the AR and MR curves.
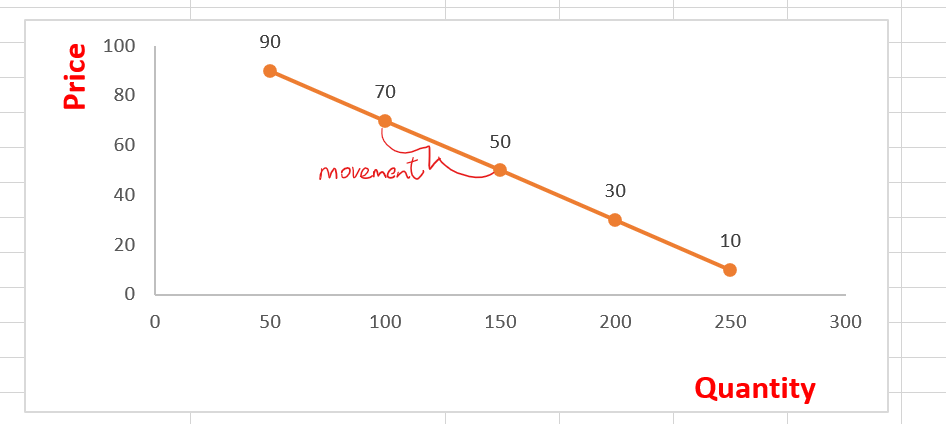
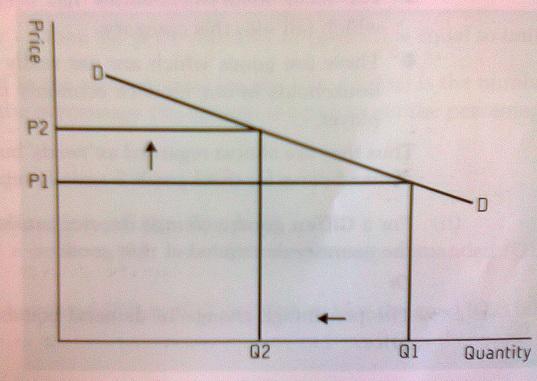
Movement along a demand curve / Shifting demand curve (click here to view a short explanation):
As price decreases quantity demanded increases (this causes a movement along the demand curve for normal goods).
Sometimes demand increases even when price remains unchanged, this is known as a shifting demand curve. In this case the demand curve shifts from D out to D2 in the diagram.
This diagram illustrates a movement along a demand curve.
While this one shows a demand curve that has shifted to the right.
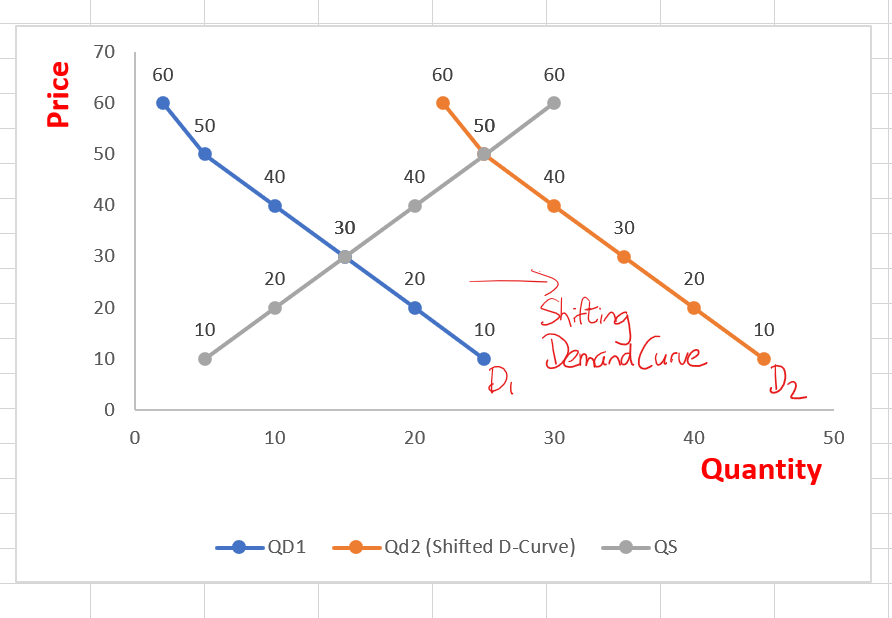
If price changes, the result is a movement along the demand curve. If something other than price changes, e.g. government regulations, the result is a shifting demand curve. Click here to see why the arrows must be drawn parallel with the y-axis.
A Giffen good (click here for a more detailed explanation) is one which is of very poor quality and as its price increases, the quantity demanded also increases. An example could be ‘own brand’ white bread, or white rice, in a country where c.60% of one’s income was spent on this good.
Substitute and Complementary Goods:
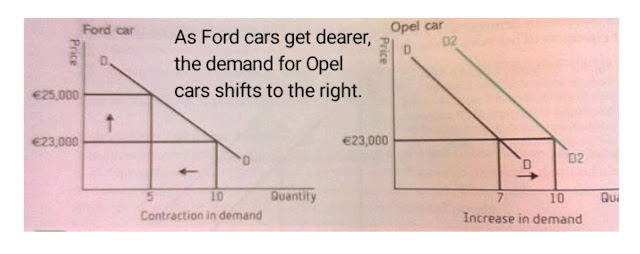
Substitute goods compete with one another. If the price of one goes up (resulting in a movement in its demand curve), then the demand for the other is likely to increase (shifting its demand curve to the right), e.g. as the price of Ford cars increase, the demand curve for their substitute (Opel cars) shifts to the right as shown in the diagram.
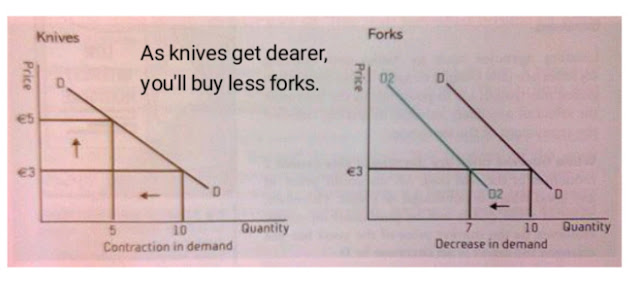
Complementary goods are consumed together. If the price of one goes up, the demand for the other is likely to decrease, e.g. knives and forks:
Different types of demand:
Composite demand: this happens when there are multiple uses for a single product. e.g. corn can be used as animal feed, ethanol and food in its whole form.
Derived demand: where the good is bought not for it's own sake but for it's use in the productive process, e.g. a concrete block is only bought because it can be used to build a wall.
Effective demand: this is the demand for a good which is accompanied by the necessary pruchasing power, e.g. I might demand a yacht, but I cannot afford one, therefore my demand is not effective.
Joint demand: refers to a situation where the demand for one product or service generates demand for another related product or service. Complimentary goods are jointly demanded as you cannot use one without the other.
Latent demand: this is demand that lacks the necessary purchasing power, e.g. my demand for a yacht could be referred to as latent demand.
Exceptions to the Law of Demand (Demand curve slopes upwards from left to right):
Giffen Goods: As price increases, more is likely to be bought.
Snob Goods (also known as Veblen Goods): demand is based on price so the more expensive the good, the higher the demand.
Goods affected by high consumer expectations: if you expect prices to increase in the future, you will buy more in the present.
Medicines and addictive goods: these goods are unaffected by price and so do not obey the law of demand.
How demand can be manipulated:
In this podcast I discuss demand manipulation in the diamond market and explain how Hollywood was used to completely alter the market demand for this precious stone.
Substitution/Income Effect:
If the price of a good goes up, demand for a substitute will go up, i.e. positive substitution effect.
If one’s income goes up, demand will also go up in the case of a normal good, i.e. positive income effect.
In the case of inferior goods, the positive substitution effect combines with a negative income effect. However, the negative income effect does not outweigh the positive substitution effect resulting in a positive price effect (the price effect is the combination of the income and substitution effects). If you recall the classroom discussion on this point, some people suggested that there could be a negative price effect if the negative income effect outweighs the positive substitution effect. This is unlikely, but entirely possible.
For Giffen Goods, the negative income effect is even stronger. However, the negative income effect, in this case, outweighs the positive substitution effect resulting in a negative price effect.
Supply (click link to view an explanation)
The Supply Curve slopes upwards from left to right, indicating that the higher the price offered for a good, the more likely one is to supply the good.
The Supply Function is as follows:
S = f(Px, Pog, C, Tch, Tx, U, G, N), where:
Px = price of the good,
Pog = price of other goods that the producer/supplier could also produce. (There is an opportunity cost involved here). This assumes that productive resources are easily interchangeable. For example, if the price of milk increases a farmer may switch from producing beef to producing milk. In doing so, there will be an extension in the supply of milk (movement (caused by a change in price) along the supply curve), but the supply curve for beef will shift to the left (less will be supplied at each price).
C = cost of production,
Tch = state of technology
Tx = level of taxation. Higher taxation increases costs to the firm.
U = unforeseen circumstances, like changes in weather.
G = role of government. This could be a new law or the introduction of a quota on production. In China the government is very bureaucratic therefore businesses are less likely to increase in size.
N = number of suppliers in the market. If there are a large number of suppliers, you are less likely to enter that industry because of the high level of competition.
Types of supply curve:
Individual supply curve: where the price/quantity-supplied combinations of an individual firm are depicted in graphical form.
Market supply / Aggregate supply: this is where the price/quantity-supplied combinations of all firms in the market are depicted graphically.
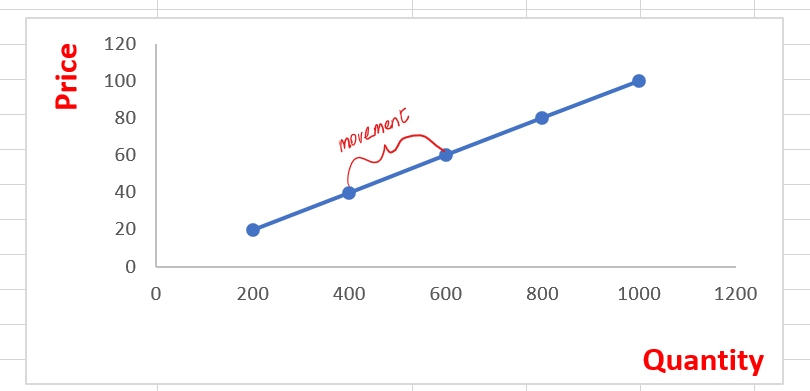
These diagrams illustrate an extension and a contraction in supply (i.e. a movement along the supply curve): Note: This is caused by a change in price.
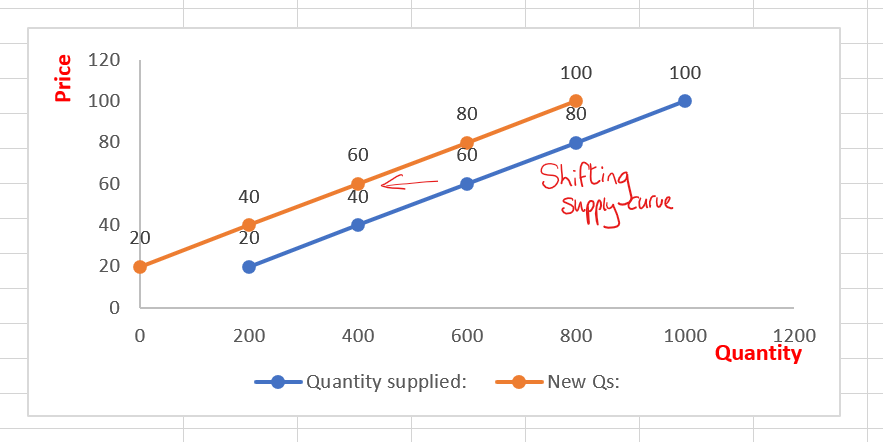
These diagrams illustrate an increase and decrease in supply (i.e. a shifting supply curve): Note: This is caused by a change other than price.
The concepts involved here are quite similar to those of the demand curve when we studied movements and shifts.
Less common supply curves:
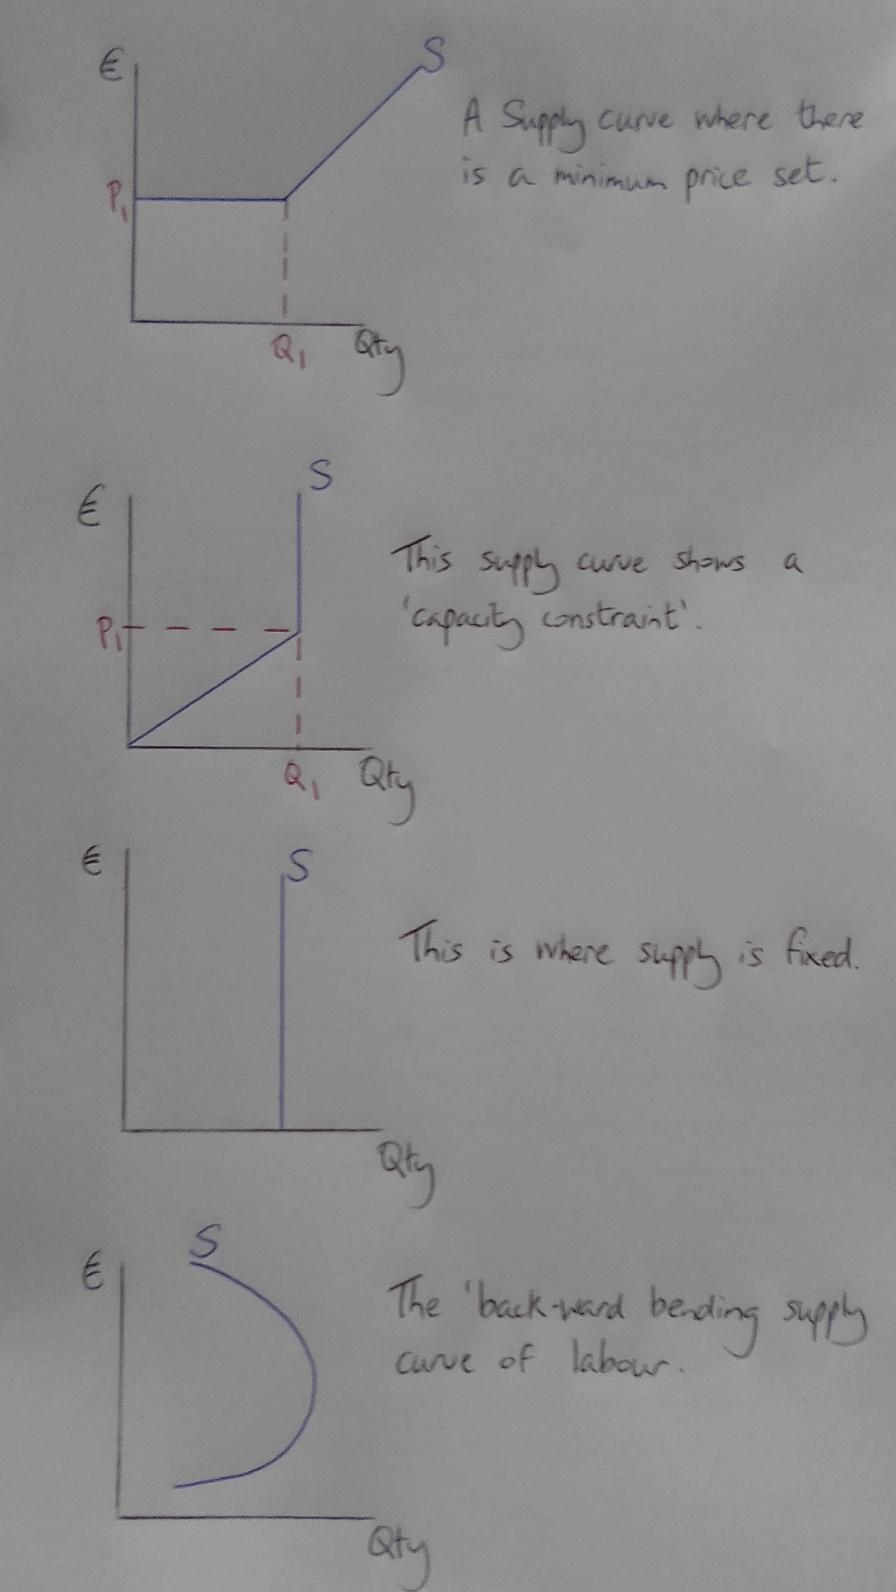
Click here to view an explanation of these unusual supply curves.
The objectives of the firm:
In some instances, a firm might wish to switch from profit-maximisation to sales maximisation. In such a case, the firm is less concerned with being as profitable as possible and instead wants to sell as many products as possible. This might be in an attempt to get rid of competitors.
A firm may also decide that other objectives are more important than profit, e.g. quality of life. In this case the firm might sell less than the profit-maximising quantity.
In either case, the firm is choosing an objective other than the standard profit-maximising one.
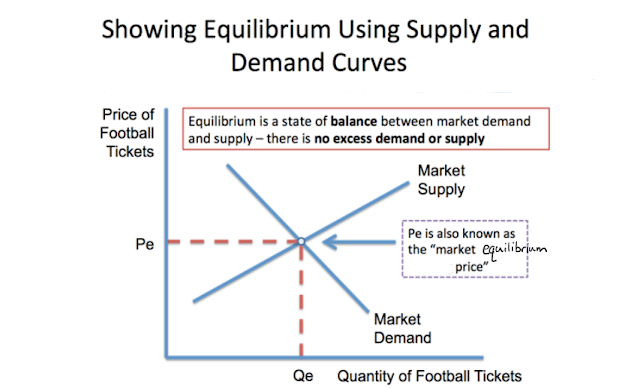
Demand and Supply in equilibrium.
The role of the price mechanism in a market economy:
Signalling function: changes in price provide information to both producers and consumers about the changing nature of market conditions. If there is a surge in demand, then the price will rise, if there is a fall in demand, then the price will fall to attract new consumers.
Transmission of preferences function: if consumers continue to buy a product even when its' price increases, they are telling the producer that they like the product so much that they do not care about the price increases.
Rationing function: the price mechanism is able to effectively sort out shortages in supply. When the price increases demand decreases, and only those who really want the product will buy it at the new higher price.
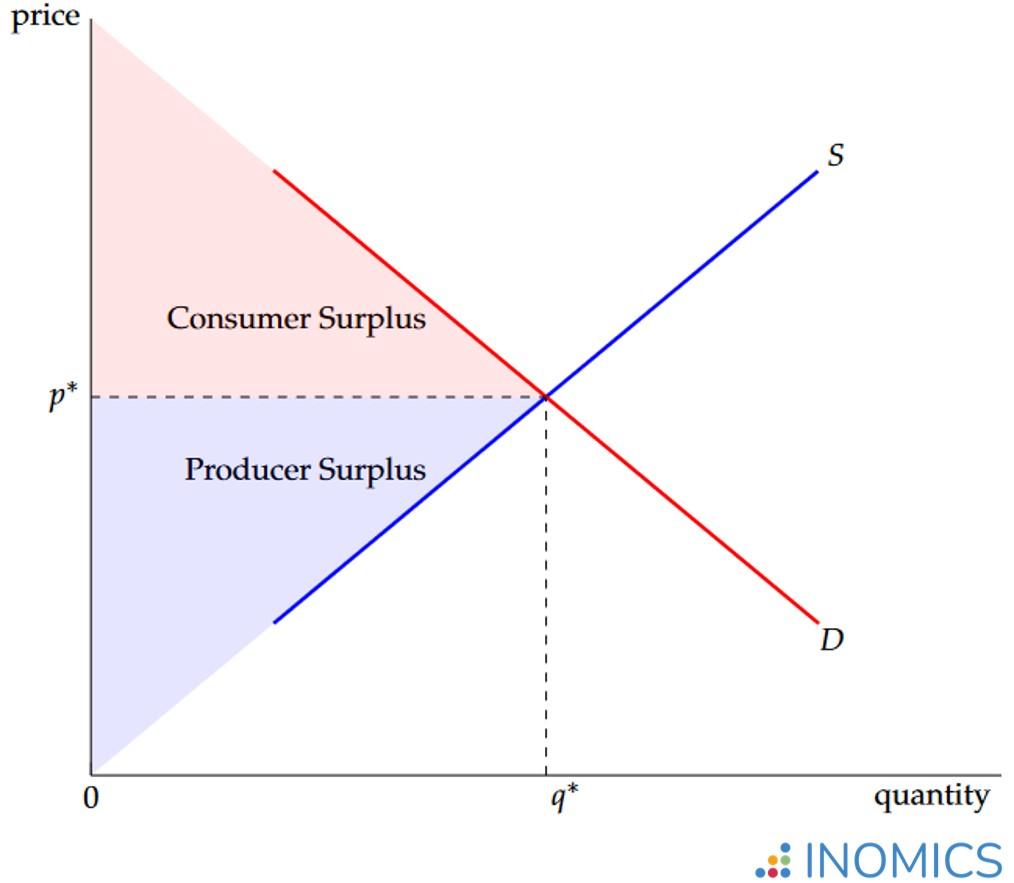
Consumer Surplus and Producer Surplus:
Consumer surplus is the difference between what a consumer was prepared to pay for a good/service and what they ended up paying, while producer surplus is the difference between what a producer is willing to accept for a good/service and what they end up getting from the market.
Illustrated in the diagram below are both concepts. Click here to watch a video explaining the concept.
How can Dynamic Pricing be used to eliminate Consumer Surplus, and thereby maximise Total Revenue?
The concept of dynamic, or surge pricing is a new one to our course. Have a look at this video which explains how dynamic pricing can be used to maximise total revenue.
How does technology affect the consumer?
Price comparison websites
E-commerce
Booking platforms
Virtual credit cards
If you are still unclear about any aspect of demand, supply, shifts or movements, then watch this video.
The key in this chapter is understanding the concept of elasticity. This video explains the basics of this concept. It refers to the sensitivity of demand to a change in price/income/change in price of a substitute/complement. I recommend that you use the same formula each time you do an elasticity question. In any case, you get the same answer.
(Download the Elasticity Calculator here.)
This video will explain the crucial link between Demand and Elasticity.
Price Elasticity of Demand (click here for an illustration of the calculation):
Change in Qd P1 + P2
Change in P x Q1 + Q2
e.g. If Good A increased in Price from €1.20 to €1.30 and the Qd of good A changed from 80 units to 70, calculate the PED.
-10 1.20 + 1.30
0.10 x 80 + 70
= -25 = -1.67
15
What does this mean?
The answer is a minus figure which means that price and quantity demanded go in opposite directions, i.e. it’s a normal good.
The 1.67 figure means that for every 1% change in price, quantity demanded will change by 1.67%. This means that this good is particularly sensitive or elastic to a price change. This video illustrated how to calculate PED using the formula on p.28 of the log tables.
In order to maximise revenue, what should this retailer do?
He should reduce his price as the resulting increase in quantity demanded will be 1.67 times the percentage change in price. (You should always give yourself a simple calculation to help work this out).
e.g. A good costs €10 and 2000 units are sold, and that good’s elasticity was 1.67. If the retailer drops his price by 10%, the Qd will increase by 16.7%, i.e. 2334 units will now be purchased. In that event, TR (Total Revenue) will increase from €20,000 (€10 x 2,000 units) to €21,006 (€9 x 2334 units).
This video explains how there are different elasticities along the same demand curve.
Demand Curves:
An elastic demand curve:
Substitute goods and in particular close substitutes, tend to have elastic demands. People can easily switch from one to another if there is an unfavourable price change.
An inelastic demand curve:

Necessities tend to have inelastic demand curves – people have to buy them and therefore care less about the price.
A Perfectly Elastic Demand Curve:

Homogenous products are perfectly elastic to a price change. This is because the consumer can buy the exact same product from another company, therefore Qd will drop to zero if the price changes.
A Perfectly Inelastic Demand Curve:
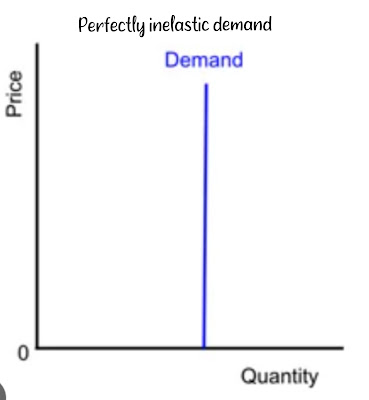
Products in extremely high demand, yet in limited supply have perfectly inelastic demand curves, e.g. All-Ireland Football Final tickets at 2pm on the day of the final.
Drawing a demand curve that reflects the PED of the good in question:
It's not enough to simply draw a downward sloping demand curve in an exam question; instead you should draw a demand curve that accurately reflects the elasticity of the good in question. This video explains this concept in more detail.
Income Elasticity of Demand (YED): (same formula as PED – just change 'P' for 'Y'):
Change in Qd Y1 + Y2
Change in Y x Q1 + Q2
If a person’s income increased from €100 to €120 per week and their consumption of a product increased from 12 units to 14, what is the YED for this good?
+ 2 100 + 120
20 x 12 + 14
+ 2 220
20 x 26
= 0.85
The fact that our answer is a positive figure tells us that Y and Qd move in the same direction, i.e. this is a normal good. Were the answer to be a negative figure, it would signify an inferior good.
What if this good had a YED greater than 1?
The fact that YED is positive tells us that the good is a normal one.
A YED greater than 1 tells us that for a 10% increase in income, the consumer will increase consumption by more than 10%.
Such a good is likely to be a luxury good.
This video explains the concept of proportionality on elasticity (both PED and YED).
Factors governing the degree of Elasticity of Demand:
The degree of necessity of the product – if it’s absolutely necessary demand for it will be inelastic.
The availability of close substitutes – the more choice people have, the more elastic demand tends to be.
The fraction of income spent on the good – when consumers only spend a small percentage of their income on a good, their demand tends to be inelastic.
The durability of the product – really high quality products tend to have elastic demands as people can delay replacing them.
The effectiveness of advertising, habits of purchasing, brand loyalty – some people will only buy Toyota so their demand tends to be inelastic.
The degree of elasticity of its’ more expensive compliment – the more elastic the compliment, the more elastic the cheaper one.
The number of uses that the product has – the more useful the less elastic, in my opinion.
The time factor – the longer people can hold off buying a product the more elastic its demand will be.
The effect of advertising on the elasticity of the demand curve:
Advertising will shift the demand curve to the right, but will also make it less elastic.
The effect of an advertising campaign on the elasticity of the demand curve is further explained in this video.
Price Elasticity of Supply:
Change in Qs P1 + P2
Change in P x Q1 + Q2
e.g.
80 20 + 30
10 x 100 + 180
= 80 x 50
10 280
= 4,000
2,800 = 1.43 This is elastic as a 1% change in price results in a 1.43% change in Qs.
[Note: This formula is used in exactly the same way as the PED formula.]
Factors governing elasticity of supply:
The degree of specialised labour or capital used in production. In the case of highly specialised industries, it is very hard for firms to respond in the short run to price changes. This makes the firm inelastic to changes in the market price.
Is the firm operating at full capacity? If so, then it would find it hard to respond in the short run to price changes.
The mobility of factors of production – the more mobile, the more elastic supply can be to a price change.
The time frame – if production takes place over a longer timeframe, then it is easier to respond to price changes.
The nature of the product – some products made in anticipation of expected demand cannot respond quickly to sudden price changes.
This video will explain the impact of elasticity on total revenue.
A cost of production is any payment which must be made to a factor of production in order to bring it into economic use.
An explicit cost: This is any cost which has actually been paid for something or is due for payment, e.g. wages, electricity.
An implied cost: This is any income foregone in order to run a business.
Towards the end of this section, you should have a look at my explanatory video on Costs.
The Short Run:
This refers to a period of time sufficiently short so that at least one of the factors of production remains unchanged. This factor could be capital, i.e. if your stock of capital remains unchanged for 6 months, then 6 months is your short run. The short run is more of a concept rather than a period of time.
The Long Run:
This is a period of time long enough for all of the factors of production to change in quantity.
Costs:
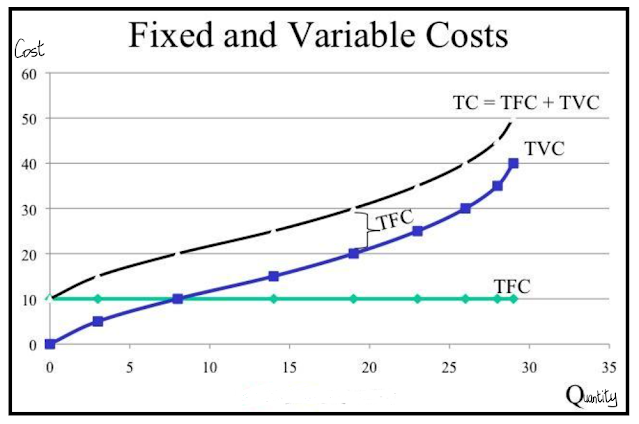
Fixed: This is a cost that does not change according to the level of production taking place. It is said to be fixed in the short run. Examples include mortgage, salaries of senior management.
Variable: These costs vary according to the amount of production. Examples here include wages of workers, costs of raw materials, electricity.
AFC: Average Fixed Cost which is FC divided by quantity produced.
AVC: Average Variable Cost which is VC divided by quantity produced.
TC: Total Costs which is FC + VC.
AC: Average Costs which is TC divided by quantity produced.
MC: Marginal Cost which is the addition to TC as a result of producing one extra unit.
This video explains all aspects of AFC, AVC, ATC and MC, (including both schedules and graphs).
The firm must cover at least variable costs in the short run. Ideally both fixed and variable costs should be covered, but fixed costs may be deferred in order to stay afloat in the short run.
The profit-maximising position:
This occurs where MC cuts MR, and after which point MC is greater than MR. Click here to view a short video on this concept.
Normal Profit:
This is an amount of money deemed necessary by the entrepreneur in order to sustain him in his current activity. It is not a fixed amount for all entrepreneurs. Normal profit is a cost of production.
Supernormal Profit:
If the entrepreneur receives any amount in excess of his normal profit, this is super-normal profit.
The Law of Diminishing Marginal Returns:
This law states that as production increases, the productivity of the extra units of labour/machinery eventually decreases, i.e. they start to get in each other’s way. This law applies to the short run.
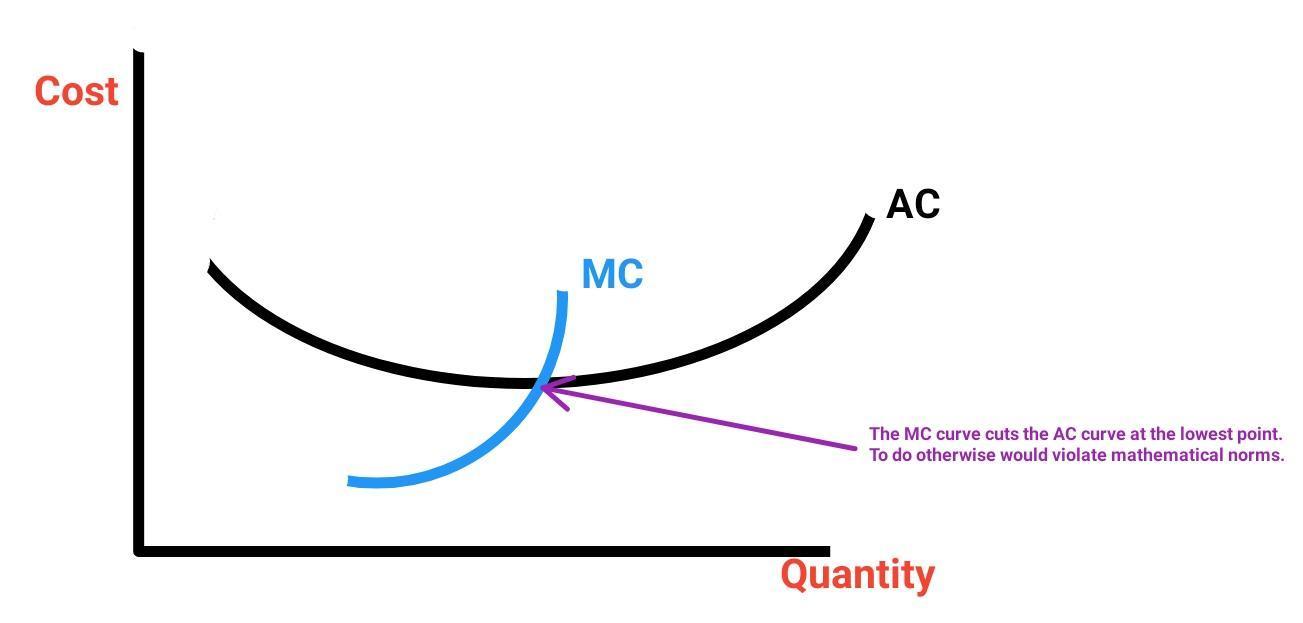
Why does the MC curve cut the AC curve at its lowest point? Diminishing returns sets in once the AC curve turns upwards. (The second reason the MC curve cuts the AC curve at its lowest point is simple maths – if it cut it earlier then THAT would be the lowest point.)
As output increases AFC decreases, but TFC remains unchanged – why?
AFC is found by dividing TFC by the number of items produced. This will inevitably decrease the more you produce. However, TFC will not change in the short run no matter how much/little is produced. You must still pay the mortgage on the factory whether you produce one item or one thousand. (TFC is represented graphically by a horizontal line at the level of the cost).
Assumptions governing the Law of Diminishing Marginal Returns:
The law only applies to the SR (Short Run)
It assumes that the same production methods are used when extra units of factors, e.g. labour, are employed
It assumes that the quality of each extra unit employed is exactly the same as all other units employed.
Costs in the Long Run:
Any producer can combine his resources in a number of different ways to produce goods. Each of these combinations results in a different SRAC curve. The graph below illustrates how each SRAC curve gives a different AC for a given quantity. A quantity, Q1 can cost between €1 and €4 to produce depending on how the factors of production are arranged in the short run.
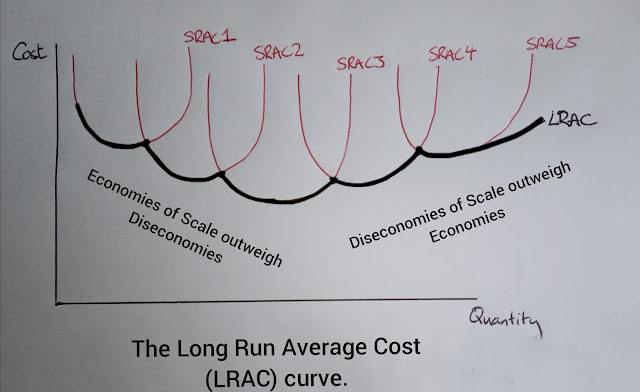
The Long Run AC curve is found by joining together the most efficient points of the SRAC curves. The LRAC curve is U-shaped.
However, the true shape of the LRAC curve is actually more undulating than the textbooks illustrate. This video explains the point in more detail.
What determines the shape of the LRAC curve?
The interaction between economies and diseconomies of scale determines its’ shape – when economies outweigh diseconomies it slopes downward. Similarly, when diseconomies outweigh economies, it slopes upward, as can be seen in the image above. Economies of scale are the advantages that accrue to the business because of its size. Diseconomies of scale are the disadvantages of size.
Internal Economies of Scale:
Financial: the bigger you are, the easier it is to get a loan. You are more likely to have plenty of collateral upon which to secure a loan.
Construction economies: it’s cheaper per sq. metre to build a big factory than a small one.
Specialisation economies. You can now hire workers to do specific tasks as opposed to hiring general operatives who are less efficient.
Purchasing economies: bulk buying is an example of where you can cut costs by buying in large quantities.
Marketing economies: it’s more cost effective to advertise when you’re bigger, e.g. you can pay for an add on national radio.
Distribution economies: transportation costs are lower per unit when you’re bigger.
Internal Diseconomies of Scale:
Managerial diseconomies: it’s harder to manage a bigger firm. It becomes more difficult to know each employee personally in a larger establishment.
Lack of morale among staff: this becomes more of a problem the bigger the firm.
Non-productive employees: workers can more easily ‘hide’ in the crowd in a larger factory.
External Economies of Scale:
Specialisation of the production of components, e.g. Jaegar speedometers
Emergence of Service industries, e.g. courier companies
Education and training
R & D (Research and Development)
Infrastructure
External Diseconomies of Scale:
Scarcity of raw materials
Lack of skilled labour
Poor infrastructure
Returns to scale: this is the relationship between the quantity of factors of production used and the resulting level of production. If output exceeds the increase in the quantity of factors of production there are increasing returns to scale, if output is less than the increase in fop’s there are decreasing returns to scale, and if output is proportionate to the increase in fop’s there are constant returns to scale.
Small Firms in the Irish Economy:
Some firms refuse to expand even if they could. It is argued that small firms are in many cases more adaptable and recession-proof. Why do many firms refuse to expand?
The limited size of market available to many Small and Medium Enterprises (SMEs) means that they are unlikely to achieve sufficient resources to enable them to expand.
Many SMEs provide a more personal service to their customers, one which they wouldn’t get from a larger enterprise.
SMEs enjoy customer loyalty due to the standard of personal service they provide.
Lots of products/services provided by smaller firms are unsuitable for large scale production, e.g. the local milkman, therefore discouraging expansion.
Financial constraints impede expansion, i.e. it can be difficult to get a loan, particularly during the current credit-crunch.
Some entrepreneurs fear a loss of control of their business if they expand.
Location of firms:
Supply-oriented firms prefer to be near the source of their raw materials. This is usually because the raw material is bulkier or more dangerous than the finished product.
Market-oriented firms prefer to locate nearer to the market. These would be industries where the finished product is bulkier than the raw materials used, e.g. furniture factories.
Footloose firms have no preference either way and will instead choose to locate in a cost efficient area. Telesales firms tend to locate in countries where labour is cheap and the communications infrastructure is reliable. Footloose industries factors such as: the cost of land, the availability of labour, reliable power supply, good transport infrastructure, proper communications system, government incentives and environmental issues.
Strand 2.4: Government intervention in the market.
Since the early 20th century economists have generally acknowledged the key role of government in regulating the economy. Economies can be pure free market (USA), command (China) or mixed (Ireland).
The key aims of government are:
Full employment: This is when everybody who seeks work can find work at the existing wage levels. A 4% level of unemployment is considered to be full employment (statistically 4% of people will not work under any circumstances).
Economic Growth: This refers to the increase in national income without changes in the structure of society (if there are changes to the structure of society it is called economic development).
Price Stability: The government hopes to keep inflation under control so as to protect the purchasing power of money.
Improvements in Infrastructure: In order to encourage enterprise the government spends large amounts of money each year on roads, railways, ports, electricity, water supplies, etc. This helps to attract direct foreign investment (FDI) and encourages the establishment of domestic businesses. A good infrastructure also improves the living standards of the citizens of a country. The National Development Plan, 2000 – 2006, involved the investment of €57bn of public, private and EU funds on infrastructural development. The NDP 2007 – 2013 planned to spend €184bn however, this has been cut drastically. Transport 21 was the capital investment framework for the development of the transport system between 2006 and 2015. It planned to spend €34bn. Again, this has been revised downwards.
Increased Exports: In order to increase the flow of money into the country and boost national income (injections), the government promotes and encourages firms that export finished goods (visible exports). The government also promotes invisible exports such as tourism.
Reduced Government Borrowing: Current budget deficits lead to increased borrowing which is a burden for future tax payers. Our current budget deficit is running at well over €10bn p.a.
Balanced Regional Development: The government tries to ensure that economic development is not confined to the cities or the east coast.
The Achievement of Social Aims: The government hopes to achieve a fairer society by providing certain essential services to poor people free of charge.
Maintain state services: Under any economic circumstances the government must ensure that the health service is maintained, and that schools are properly funded.
Care for the environment: The role of government is crucial to care for the environment.
Avoid market failure: The government must do all it can to prevent market collapse, and to stimulate an economy when sluggish.
How do governments intervene in the economy?
By collecting taxes – both direct (PAYE) and indirect (VAT).
By paying social welfare, e.g. Job Seekers Benefit, Children's Allowance. (Note that for the purpose of calculating National Income statistics social welfare is a Transfer Payment since no factor of production has been supplied, and therefore not counted.)
By providing subsidies or grants.
Through state provision and companies: the government can establish a company which provides a necessary service for society, e.g. Bus Eireann.
Through government departments, e.g. the Department of Education and Skills.
By imposing new laws, e.g. The Sale of Goods and Supply of Services Act, 1980. Laws can be used to influence consumer behaviour, e.g. the smoking ban, the traffic-light labelling system for food. The Consumer Rights & Personal Finance website is worth a view.
By representing people at EU level – the image below lists the main benefits of EU membership:
By taking action during national emergencies, e.g. during the financial crash the government needed loans from the EU, the IMF and the ECB (as well as Denmark, Sweden and the UK).
By redistributing income: over the years wealth can accrue in the hands of the diligent, the intelligent, the talented or sometimes just the lucky. It is the job of the government to ensure that wealth is redistributed more fairly. Whether or not you agree with this point says a lot about where we might find you on the Political Spectrum.
In what ways can the government redistribute wealth more fairly:
Minimum wage: The introduction of a minimum wage in Ireland is intended to ensure that even the lowest paid workers are guaranteed a certain standard of living. It is illegal to pay a worker less than the minimum wage set for their particular terms of employment. There are a few different minimum wages, one for 16 – 18 year olds, another for 18 – 20 year olds, and the standard minimum wage for all workers above the age of 20. When we speak of the minimum wage, we are usually referring to the one for the over 20's. The most up-to-date figure will be on the Latest Economic Data page of this website.
Progressive taxation: This is where wealthier people pay proportionately more income tax than the less well-off. In other words, a person earning €20,000 per year might pay 20% tax whereas a person on €50,000 would pay 40%. Progressive taxation is a direct tax inthat it directly targets income.
Regressive taxation: Regressive tax refers to a tax that is applied uniformly regardless of income. Regressive taxes take a larger percentage of income from low-income earners than from middle- and high-income earners. Examples include carbon taxes, tv licences and VAT. These taxes are said to be indirect taxes inthat they do not directly target income.
Advantages and disadvantages of government intervention:
Advantages:
Foreign Direct Investment: The government has the authority to offer tax breaks to large multinational companies to encourage them to invest in Ireland. A controversial example of this policy is the on-going case involving Apple Computers and the Irish government where the EU has said that Apple owed much more in corporation tax than they actually paid.
Regulates the development of monopolies: No government wants monopolies to get too big.
Provides employment: This follows Keynesian economics which encourages the government to provide employment when needed.
Non-profit companies: The state can step in to provide essential services it deems necessary, e.g. bus routes to remote parts. Since Bus Eireann is backed by the state it can provide such services without the worry of pleasing shareholders.
Provision of social welfare, health, education and public goods.
Disadvantages:
Government involvement in the economy can reduce entrepreneurship and initiative: In the United States for example, where the government is much less involved in the provision of goods and services, the spirit of free enterprise is much more vibrant.
Inefficiency and 'red-tape': With high levels of state involvement comes lots of bureaucracy and rules.
State employees are not incentivised by output: While most state employees do an honest days' work, there is little or no reward for those who go beyond the call of duty. Think of the compassionate and caring nurse in the hospital who puts her patients needs before her own and ask yourself how she is rewarded for this. (She isn't).
What government bodies are responsible for implementing and monitoring regulations?
Regulatory bodies in Ireland fall into a number of categories:
Government departments draft legislation and are responsible for its' enforcement;
Local authorities can make by-laws;
Statutory regulators; and
Public sector bodies like the HSA.
The following is a list of some of the other bodies involved with regulation in Ireland:
Commission for Communications Regulation: ComReg is the statutory body responsible for the electronic communications sector.
Environmental Protection Agency: a public body which protects the environment.
The Nursing and Midwifery Board of Ireland (NMBI): carries out its functions in conjunction with a number of other bodies, including other regulators.
Food Safety Authority of Ireland: responsible for monitoring food safety in Ireland.
Dental Council: The dental profession in Ireland is regulated by the Dental Council of Ireland.
Health and Social Care Professionals Council (CORU): CORU is Ireland’s multi-profession health regulator.
Health Information and Quality Authority (HIQA): HIQA is the independent authority established to drive continuous improvement in Ireland’s health and social care services.
Health Products Regulatory Authority (HPRA): Formerly the Irish Medicines Board (IMB), HPRA regulates medicines, medical devices and other health products.
Health Service Executive (HSE): The HSE provides all of Ireland’s public health services.
Medical Council: The Medical Council regulates medical doctors in Ireland.
Mental Health Commission: The Mental Health Commission promotes high standards and good practices in the delivery of mental health services and protects the interests of patients who are involuntarily admitted.
Pharmaceutical Society of Ireland: The Pharmaceutical Society of Ireland regulates pharmacists and pharmacies in Ireland.
Pre-Hospital Emergency Care Council (PHECC): (PHECC) set the standards for education and training for pre-hospital emergency care in Ireland.
Road Safety Authority: this public body aims to save lives on Irish roads.
What is the need for regulation?
In theory, the major economic justifications for and role of regulation are fairly clear cut:
To address market failures where true costs and benefits are not reflected correctly in market prices;
To reduce barriers to entry, “level the playing field,” encourage greater competition and innovation, and combat short-sightedness like where a decision is made which solves a problem in the short-term but leads to even more difficulties in the long run.—all to increase economic growth; and
To ensure consumer, worker and investor safety, transparency in information about products and services, and a fair distribution of net benefits. This category is often labeled “social regulation,” but these policies also have economic justifications and implications.
To provide public goods like street-lighting, public parks, libraries etc.
Is regulation effective?
Some benefits of regulation in the economy include safer worker environments, safer food, better consumer protection laws, safer roads and a cleaner environment. Effective regulation can correct market failures caused by asymmetric information, where one party has inadequate information to enable them to make an informed choice.
On the other hand, adherence to strictly enforced regulations can impose a hefty cost on businesses. Even schools and other non-profit organisations are subject to government regulations and must implement these rules regardless of the cost. In the case of businesses, these costs are usually passed on to the consumer.
Those of you on the right of the political spectrum regularly argue for less regulation in the economy and an end to the so-called “nanny-state”. Many sensible arguments can be made in favour of this position, however, it is the opinion of this economics teacher that the public appetite for increased regulation of the public sphere has not yet been sated.
Now that you've finished this strand, why not test yourself on these notes.