Click here to have these notes read to you (Chrome).
Strand 3 .1 Market structures.
A summary of the key points of the Market Spectrum is contained in the image below. I also recommend you listen to this podcast summarising the assumptions of the Market Spectrum.
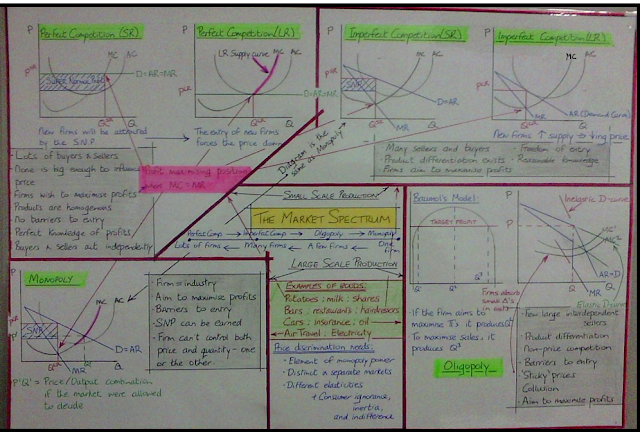
I have explained the basic concepts of the market spectrum diagrams for anyone who finds them difficult to draw.
Perfect Competition.
Click here for the Short Run Equilibrium diagram.
Assumptions:
Many small firms in the industry each produce such a small quantity that they are unable to influence the market price, e.g. a farmer producing milk.
Many buyers in the industry, each one buying such a small amount that they cannot influence the selling price.
All firms aim to maximise profits, that is, they will produce at the point where MC = MR, but where MC is rising.
There is freedom of entry and exit into and out of the industry, i.e. there are no legal or financial barriers protecting the industry.
There is general knowledge as to the profit levels pertaining in the industry.
All products produced are homogenous.
All firms produce at the lowest point on the AC curve (see graph above).
This video on Perfect Competition should help your understanding of this concept.
The Long Run Equilibrium (click here for diagram) of a Firm in Perfect Competition:
Price: Each firm is a price taker, not a price maker. The price is set by the interaction of market demand and market supply.
Quantity: The firm aims to maximise profit which means that it will produce that quantity where MC = MR provided that MC > MR after that. (Ensure you understand why this is so).
Profit Level: The perfectly competitive firm can only earn a normal profit as there is freedom of entry AND good knowledge of profits.
Production takes place where AR = AC = MR = MC, which is here.
Supernormal Profit in the Short Run (click here to see how SNP is eliminated in the Long Run):
There is general knowledge of profits, therefore other firms will enter the industry, under-cut existing firms’ prices and thereby eliminate the SNP, e.g. this happened in 2008/09 in rape seed production. SNP is not possible in the Long Run Perfect Competition.
Advantages of Perfect Competition:
The product is produced and sold at the lowest point on the AC curve ensuring the lowest possible price for the consumer.
Because production takes place at the lowest point on the AC curve, there is no wastage of resources.
All products are homogeneous and therefore of identical quality.
Perfect competition encourages efficiency as only those who can produce at the lowest point on the AC curve will survive.
Disadvantages of Perfect Competition:
There is no choice as all goods are identical/homogeneous.
As all firms are relatively small, they will not benefit from economies of scale, therefore, even though they produce at the lowest point of their AC curves, this may not be as efficient as production could theoretically be.
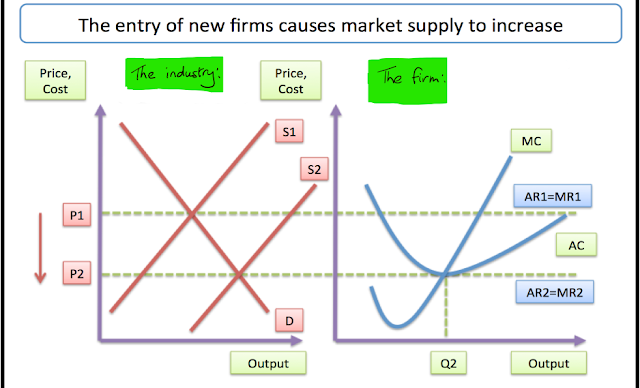
The diagram above illustrates what happens in Perfect Competition when new firms enter the market. The supply curve shifts out to the right thereby increasing supply and lowering the market equilibrium price. Since firms are price takers, they have no choice but to accept the new price of P2. At P2 they are only able to cover AC, thus the short-run SNP is eliminated.
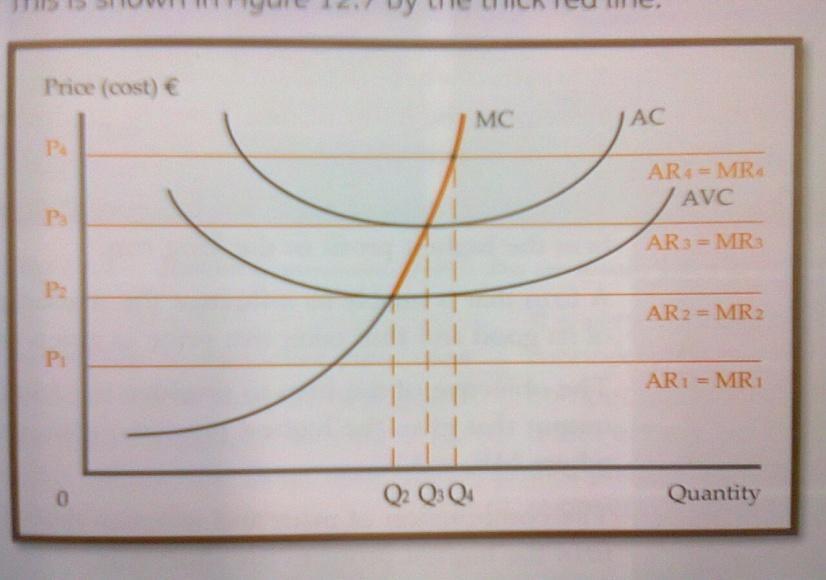
The shape of the supply curve in Perfect Competition:
The short-run supply curve of a firm under perfect competition is that part of the MC curve which lies above the AVC curve. In the long run, it is that part of the MC curve which lies above the AC curve.
The main advantages of Perfect Competition include:
Production takes place at the lowest point on the AC curve.
The consumer is not exploited as only the minimum price is charged.
Advertising is pointless since goods are homogeneous.
Efficiency is encouraged.
Disadvantage include:
No choice for consumers as goods are identical.
No possibility that the consumer can take advantage of economies of scale being passed on to them because no economies exist due to the limited size of the firm operating in perfect competition.
Monopoly.
Assumptions:
The firm is the industry.
The firm aims to maximise profits.
There are barriers to entry.
The monopolist can control either the price charged or the quantity sold, but not both.
How monopolies arise:
Through legislation – governments grant monopoly licences in certain circumstances.
Through mergers and take-overs.
The firm has sole access to an essential factor of production.
Economies of scale.
Cartels – large scale operators come together to form a virtual monopoly.
Product differentiation and advertising: A firm can sometimes create such loyalty to their product that they create a monopoly situation.
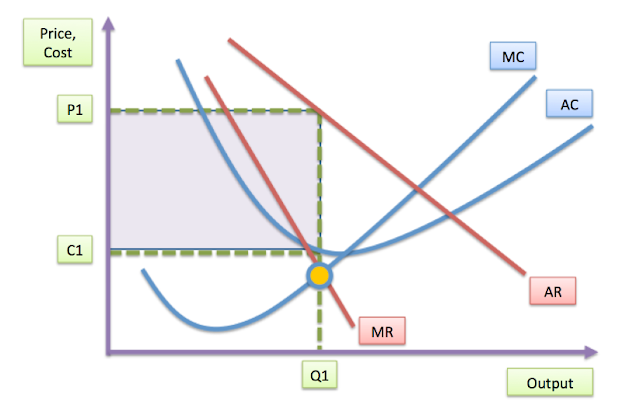
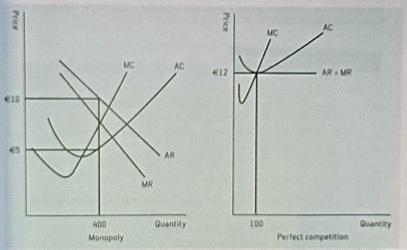
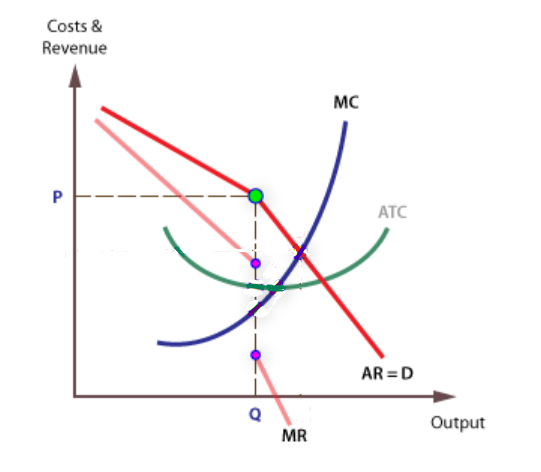
Long Run Equilibrium for the Monopolist (click here for diagram):
Production takes place where MC = MR, but MC > MR after that point.
The market price for this good, found by drawing a line up from the profit maximising position, provides the firm with a SNP.
As there is no freedom of entry into the market, the short and long run equilibrium positions are the same in monopoly – there will be no competition to erode the SNP.
The diagram shows the short and long run equilibrium position under monopoly. There is no erosion of SNP as there is only one firm, therefore no other firm can enter the market to offer the good at a lower price.
Advantages of Monopoly:
Monopolists usually benefit from economies of scale and can therefore produce at a lower cost than smaller firms. The reduction in cost might be passed onto the consumer.
Duplication of resources is avoided. Smaller firms may buy specialised machinery which might be under-utilised due to their smaller scale of operations, this would not happen in a monopoly.
Monopolies tend to provide secure employment as people have no alternative but to consume their product.
Increased potential for research and development. The huge SNP's available provide the funding for such endeavours.
Guaranteed supply of the product. It is less likely that consumers will be deprived of goods produced in this way than in the other more competitive markets.
Disadvantages of Monopoly:
Monopolists cannot produce at the lowest point on the AC curve, therefore it is said to be wasteful of resources.
As SNP is earned, it can be argued that the consumer is being exploited.
Consumers have no alternative, they have no choice but to consume the monopolist’s product.
The monopolist has no incentive to innovate as there is no competition.
The monopolist is in a position to practise price discrimination and thereby further exploit the consumer.
The monopolist can control either price or quantity supplied, but they can cut supply in order to push up prices leading to the under-utilisation of resources.
Control of Monopolies:
The Irish Government is reluctant to allow the creation of monopolies unless they are in the national interest. The following laws govern the formation of monopolies:
The Restrictive Practices Act, 1972:
Under this Act the Minister can:
Prohibit restrictive practices which prevent or restrict competition
Prohibit unfair methods of competition
Make such provisions as deemed necessary to ensure the equitable treatment of all persons in regard to the supply of or distribution of goods or the provision of services.
Mergers and Takeovers (Control) Acts, 1978 to 1996:
Under this Act, the Minister can prohibit any merger or takeover they deem to be contrary to the public good in terms of competition, e.g. if Ryan Air and Aer Lingus were to merge, the Minister would very likely intervene to prevent the merger on the grounds of competition.
The Competition Act, 1991:
This Act gives the Minister the power to intervene in the market where they suspect uncompetitive practices regarding the sale or distribution of products or services, e.g. if the ESB were to offer reduced-price phone lines to their customers, the Minister would intervene on the grounds that this service should be offered to all consumers regardless of whether they are ESB customers or not.
The following is a concept that might be examined in a Leaving Cert. question:
Describe the effect on the equilibrium of a monopolist of the imposition by the government of a lump sum tax. When answering this question remember that the tax will vary with the level of production.
The imposition of any tax does not necessarily mean that revenue will suffer – the firm has the option of absorbing the tax itself. This is particularly true in monopolies where SNP’s are earned. The firm may simply choose to pay the tax itself and not pass it on to the consumer in the form of higher prices.
In the event that the tax is passed on to the consumer, the price of the good will increase. The diagram shows the equilibrium position of a monopolist.
Production takes place at the profit maximising position where MC = MR (after which MC > MR). If the firm were to pass on the tax to the consumer, there would be a movement along the firm's Demand curve resulting in less being bought. The reduction in demand would be determined by the elasticity of demand faced by the firm. The new MC curve, MC2, cuts the MR curve at the new profit maximising position (there should also be a new AC curve to match MC2). Qd has decreased to the new equilibrium level of Q2.
Monopoly vs Perfect Competition:
Are employees better off in a perfectly competitive industry or in a monopolistic industry?
Employees in perfectly competitive firms benefit from a greater choice of workplace than those in monopoly.
Due to the large number of firms, employees in perfectly competitive firms have greater bargaining power than those working for monopolies.
However, as the monopolist earns SNP, it is more likely that their employees may earn economic rent.
Promotion may be easier to attain in monopoly.
Employment is probably more secure in a monopoly, particularly a state-backed one.
Are consumers better off if the goods are produced under monopoly conditions or those of perfect competition?
The fact the perfectly competitive firm does not earn a SNP means that consumers are not exploited to the extent that they would be under monopoly. However, as the diagram below shows, the perfectly competitive firm does not benefit from economies of scale, therefore may produce at a higher equilibrium price than the monopolist.
By not producing at the lowest point on the AC curve, monopolists are not producing the goods as efficiently as they might be. This might mitigate against the consumer.
How can the efficiency of semi-states be improved upon?
Appoint experienced business managers as opposed to political appointees.
Introduce a profit motive for the management team (although this did not work with the banks).
Avoid government interference in the running of the firm.
Introduce competition through de-regulation into the industry, e.g. the telecommunication market in Ireland has seen improved service and better value to customers since de-regulation.
Price Discrimination.
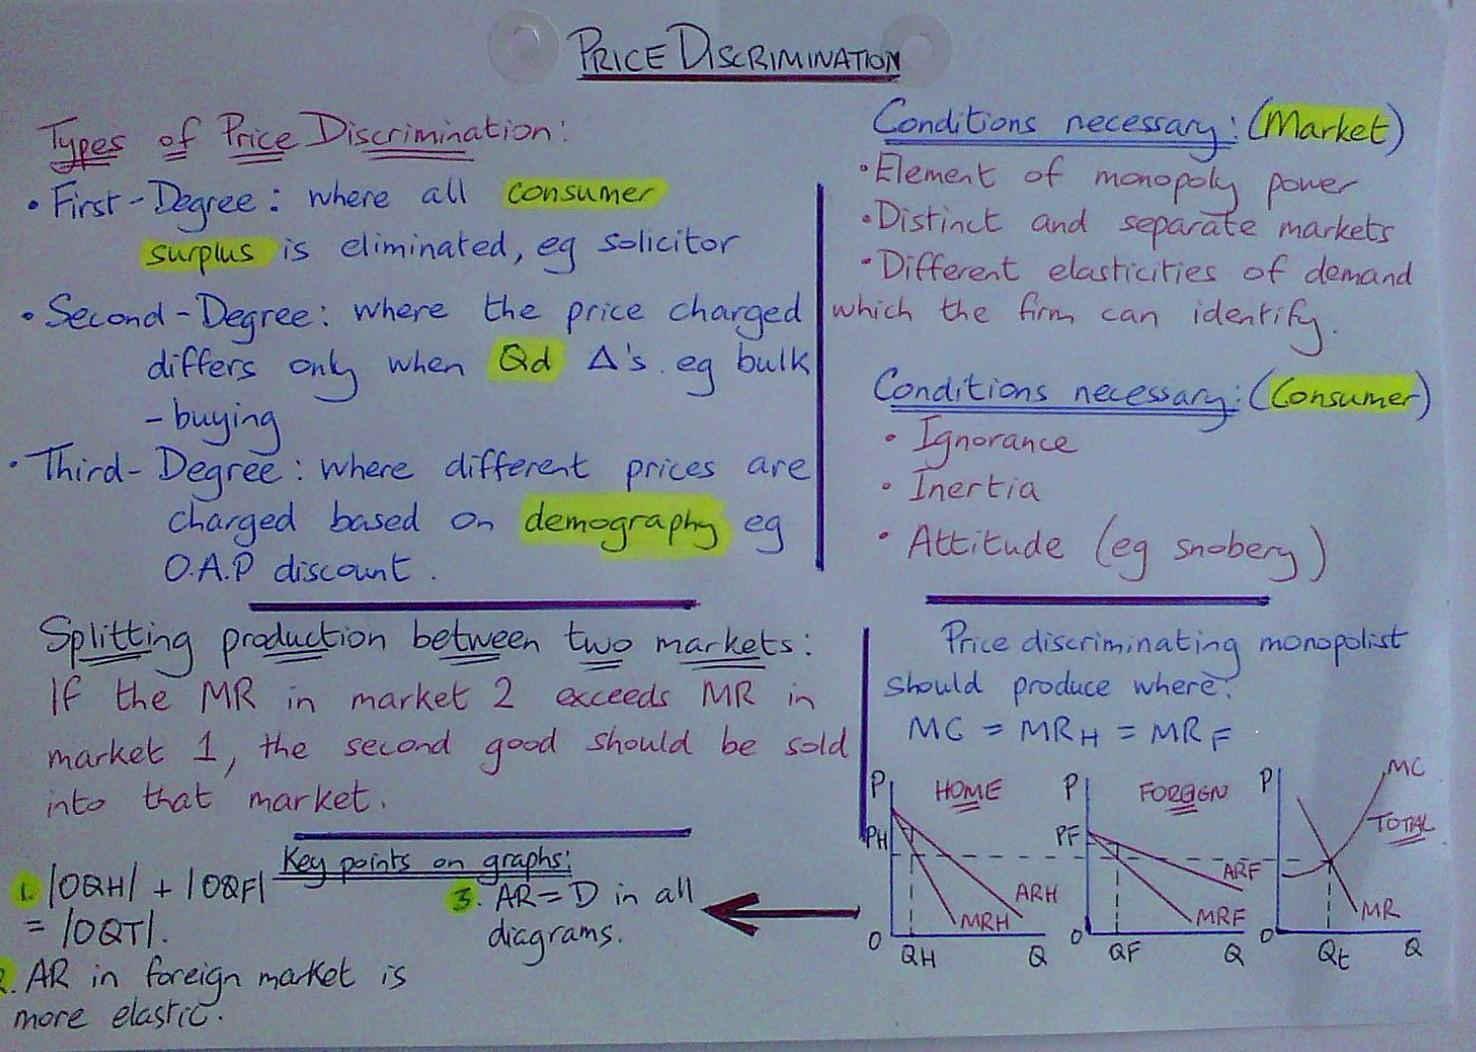
Price discrimination takes place when the same good/service is sold to different people/markets at different prices even though costs of production remain constant. The information below is a summary of the key points of price discrimination:
There are 3 categories which are explained in this video on Price Discrimination:
First Degree: This occurs where there is blatant discrimination against a consumer in an effort to eliminate their consumer surplus (the difference between what a consumer is prepared to pay for a good/service and what they end up paying). It can only occur where there is great knowledge about individual consumers and their ability to pay, e.g. a solicitor would be able to judge a clients’ ability to pay and is therefore able to eliminate their consumer surplus.
Second Degree: A milder form of discrimination where the consumer avails of a discount by buying in bulk, or, by availing of various discount schemes, e.g. consumers avail of “loyalty card” discounts in the various supermarkets. Such discrimination is, in most cases, easy to detect and is carried out with the consent of the consumer, e.g. by taking out a year’s membership to the gym you can go each day for much less than by paying on a daily basis.
Third Degree: This occurs where consumers find themselves in various categories, e.g. student and OAP discounts on public transport. Price charged is based on an individual’s price elasticity of demand. People generally recognise that society is better off because of this type of discrimination.
Conditions necessary for Price Discrimination to occur:
A degree of monopoly power, e.g. doctors are not a monopoly but there might be only one within easy reach of where you live.
A degree of separation in the market – it must be possible to distinguish between different categories of consumer, e.g. students are not able to buy bus tickets at the discounted rate then pass them on to adults.
Consumer indifference – sometimes people simply don’t care that they’re being charged more, e.g. a person who really wanted to see a football match on Sky TV won’t care that they’re being ripped off.
Consumer ignorance - the consumer is often unaware that they’re being ripped off, e.g. banking charges vary wildly from bank to bank but many people are unaware of this.
Different elasticities of demand: The firm must be able to distinguish between the consumers in regard to their ability and willingness to pay.
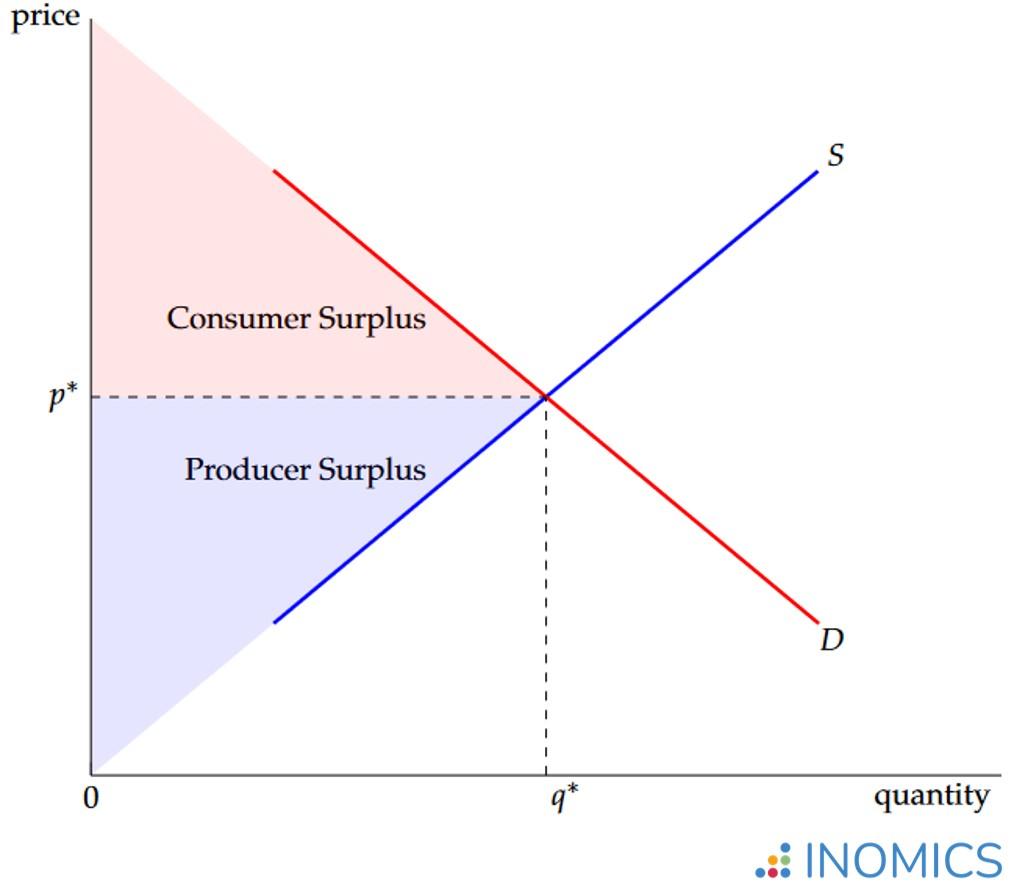
Consumer Surplus and Producer Surplus:
Consumer surplus is the difference between what a consumer was prepared to pay for a good/service and what they ended up paying, while producer surplus is the difference between what a producer is willing to accept for a good/service and what they end up getting from the market.
Illustrated in the diagram below are both concepts. Click here to watch a video explaining the concept.
Price Takers Vs Price Makers:
In order for a firm to be a price maker, there must exist some difference between their product, and those of their competitors. If you sell a homogenous good, you will be a price taker; if you are a monopolist, then you can set your own price. In between, your ability to price discriminate will determine whether or not you can set your own price.
As in a monopoly, firms in monopolistic competition are price makers, rather than price takers. However, their nominal ability to set prices is effectively offset by the fact that demand for their products is highly price-elastic. In order to actually raise their prices, the firms must be able to differentiate their products from those of their competitors by increasing their quality, real or perceived.
How does product differentiation affect the demand curve for a product?
The greater the difference between your product and other products the more inelastic the demand curve will be. This means that demand will be less sensitive to a change in price because consumers think that your product is somehow different to the other alternatives on the market. Alternatively if there isn't much difference between your product and other options available the demand curve will be much more elastic. Consider the demand curve in perfect competition where there is no alternative at all, as the goods are homogeneous. That demand curve is perfectly elastic. Click here to view an explanation of this concept.
The Equilibrium position of the price discriminating monopolist:
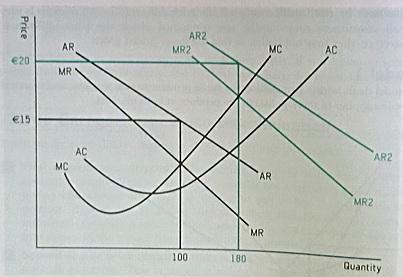
The two different AR curves indicate the separate markets.
AR2 is a market where he can charge €20 for the product, whereas in AR, he can charge only €15 for the same product.
The equilibrium quantity is 180 units of which 80 are sold at €20 each and 100 at €15 each.
TR in the above example would be €3,100, i.e. (15 x 100) + (20 x 80).
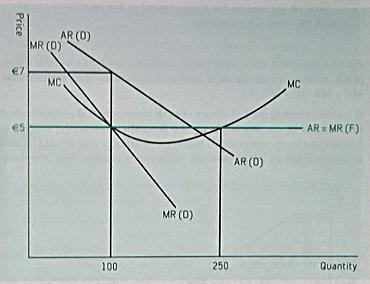
Long Run equilibrium when selling on both the domestic market and the foreign market:
Again, there are 2 separate AR curves indicating the separate markets. AR (D) represents the domestic market and AR (F) the foreign one. Note the perfectly elastic AR (F) curve will illustrate the perfectly competitive nature of the foreign market where our firm is just a small player. Note further how the quantities of 100 and 250 are established, i.e. where MC cuts MR after which MC > MR.
The equilibrium quantity is 250 units of which 100 are sold on the domestic market at €7 each and 150 on the foreign market at €5 each. Renault manufactures a car which they only sell in India for €2,600. In this way they are maximising their revenue by selling at a price in a foreign market which earns them a normal profit, while still making a SNP in the European market. There is an unusual separation of markets in this example in that the car only meets Indian standards of safety.
It would be illegal on European roads.
Normal profit on the foreign market and supernormal profit on the domestic market:
Based on the information in the previous diagram, this one illustrates how the firm is earning SNP on the domestic Market, but only Normal Profit on the foreign one.
Monopolistic Competition/Imperfect Competition.
Assumptions:
There are many firms in the industry, all of whom are producing unique products which are close substitutes for each other. (Listen to my podcast on creating a difference (Monopolistic Competition) to further explain this point.).
There are many buyers in the industry.
The firms engage in product differentiation which enables them to become price makers more than price takers.
All firms aim to maximise profits.
There is full/reasonable knowledge of the profit levels being earned in the industry.
There is freedom of entry and exit from the industry.
There can be competition between the firms for the factors of production – they do not have a perfectly elastic supply of the factors of production.
Have a look at this video on Monopolistic Competition and what happens when you go from the short to the long run.
Short Run Equilibrium (click here for diagram):
As the diagram illustrates, SNP can be earned in the short run. This only persists until other firms learn of the SNP available. They can do this as there is full knowledge of profits.

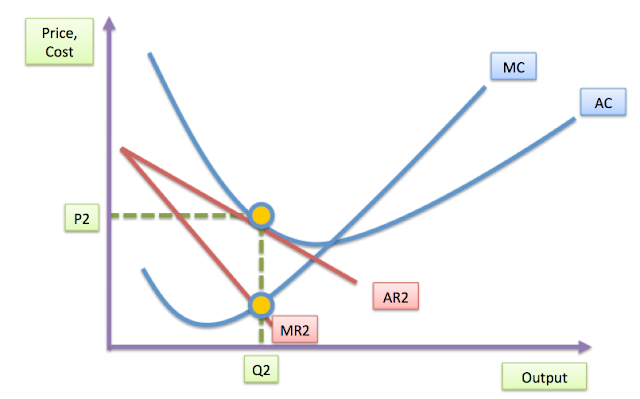
Long Run Equilibrium (click here for diagram):
Due to freedom of entry and exit to and from the industry, firms may enter and avail of the SNP. As they do so, SNP is eroded until the equilibrium quantity of 100 units is reached. Only normal profit is earned at this point. Additional supply of the product onto the market causes the price to decrease, while costs increase.
Cost shift upward because:
More firms are competing for factors of production
Firms engage in competitive advertising in order to increase their share of the market.
Why does the imperfectly competitive firm not produce at the lowest point on the AC curve?
The firm is engaged in competitive advertising which is a ‘non-production’ cost.
It can’t, because the firm faces a downward sloping demand curve which, by its very nature, cannot touch the AC curve at the lowest possible point.
Advantages of monopolistic competition/imperfect competition:
Consumers get a choice.
Employment is created in the advertising industry.
Advertising revenues cheapen newspapers, and provide funding for sports organisations.
Consumers are not exploited as in monopoly as the firms only earn Normal Profits.
Disadvantages of monopolistic competition/imperfect competition:
The firm does not produce at the lowest/most efficient point on the AC curve.
There is ‘excess capacity’ meaning that as there are so many firms operating in the industry, none can avail of economies of scale.
The advertising costs incurred by the firms are more often than not passed on to the consumer.
Forms of advertising:
Generic, where the good itself is promoted rather than an individual brand, e.g. “drink more milk”.
Competitive, where the difference (real or imaginary) between two or more goods is highlighted, e.g. Brand X is better than Brand Y.
Persuasive, where one's emotions are played upon to buy a product, e.g. “because you’re worth it”.
Informative, where some useful information is imparted, “smoking kills”.
Oligopoly.
Assumptions:
Industry dominated by a few large but interdependent sellers producing goods that are close substitutes of each other.
Barriers to entry exist.
Firms aim to maximise profits.
Firms collude with each other.
Product differentiation takes place.
Have a look at my video on the main concepts of Oligopoly - The Kinked Demand Curve and Sticky Prices.
Long run equilibrium in Oligopoly (click here to view a short clip on the graph below):
This diagram also shows that there are several positions where MC could equal MR (anywhere between the purple dots). In other words, there is a certain scope within which the firm may increase costs without passing them on to the consumer. This concept is known as price rigidity or “sticky prices” (see diagram below).
Barriers to entry:
Economies of scale.
Limit pricing which is where existing firms in the industry deliberately set a low price so as to discourage others from entering the market.
Channels of distribution may be controlled by existing firms to the disadvantage of potential entrants to the industry.
Brand proliferation where existing firms saturate the market with their products thus leaving very little room for new entrants.
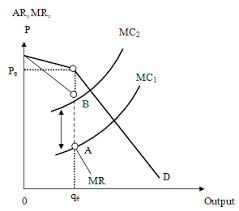
Price Rigidity (click here for explanation):
The diagram (below) shows that even if costs increase from MC1 to MC2, the firm will not increase its price to the consumer. Instead, it will absorb the cost increase so that the equilibrium price is maintained. Any cost increase in that A-B range (shown on the diagram) will still result in the profit maximising position where MC cuts MR, but Price and Qd will remain unchanged.
Forms of collusion:
Price fixing: Where firms (usually secretly) agree to charge customers a certain price. New firms are not free to set their own prices and decide to opt out of the market.
Limit pricing: Similar to price fixing except that it is typically one low enough to discourage new firms from entering the market.
Agreement to avoid competition in certain sales areas, either product related or geographical.
Agreement to a quota system, like when OPEC countries decided to curtail the supply of oil during the 1970’s.
Exclusivity: which is where firms refuse to supply retailers who do not exclusively stock their goods.
Forms of non-price competition:
Special offers, e.g. BOGOF,
Free gifts
Sponsorship
Money-off coupons
Competitions
20% Extra for the same price
Free promotional samples
Loyalty card systems (these are also used as a form of Direct Marketing).
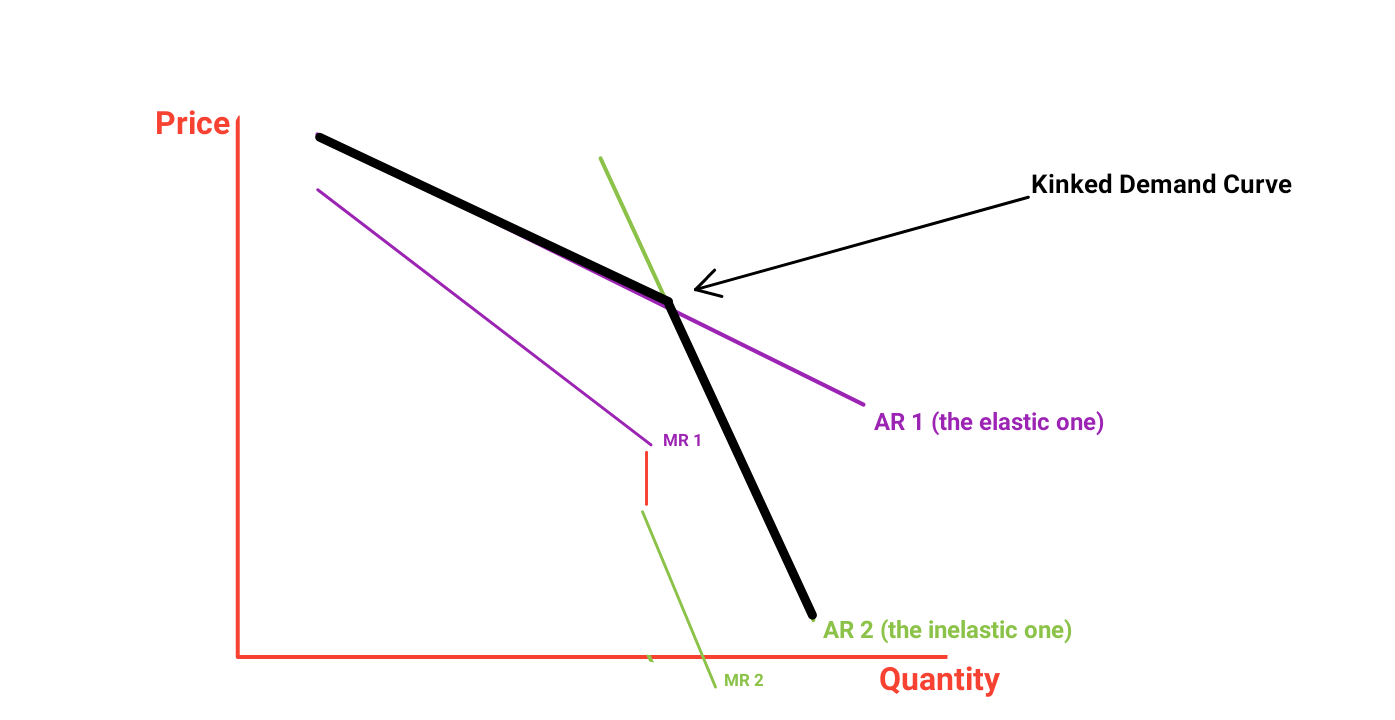
The Sweezy Model:
As oligopolistic firms collude with each other, there is no gain to be made from lowering your prices in order to increase market share – competitors will just lower their prices too. Hence, for decreasing prices firms face an inelastic demand (AR) curve like the one shown.
Similarly, if a firm increases his prices, the others will leave him there and watch his sales collapse. Therefore, for increasing prices, the firm faces an elastic demand curve as depicted by AR (el) in the diagram.
Consequently firms are reluctant to change their prices. The result is the “kinked” demand curve in oligopoly. This video explains the shape of the demand curve in Oligopoly. The demand curve is the amalgamation of two AR curves (each with a different elasticity). Each AR curve has its own MR curve, as shown in the diagram.
Reasons Why Consumers Prefer Price Competition:
It leads to cheaper prices.
The ‘extras’ offered under non-price competition are usually ‘paid for’ in higher prices, so you’re not really getting a ‘free gift’.
These ‘extras’ are often gimmicks and represent very poor value for money, who really needs another shower radio that will last about two showers before it suffers water damage.
Consumers often don’t cash-in their vouchers so they end up paying for something they don’t use.
Benefits of Non-Price Competition to Consumers:
It leads to more stable prices
Producers are encouraged to produce better quality goods
Benefits of advertising e.g. sponsorship of teams
Consumers are more informed
Consumer loyalty is rewarded
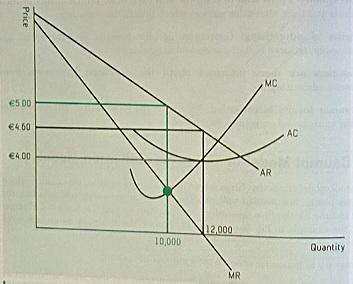
Baumol’s Model:
Firms may produce at a quantity other than the profit maximising quantity of MC = MR after which MC > MR, which would be 10,000 units. Instead, they may produce up to 12,000 units at a price of €4.60. At the profit maximising position, TR = €50,000, at quantity 12,000, TR = €55,200 (though this is not the profit maximising position, rather it is the revenue maximising position, where MR = 0). SNP is earned at this point.
There is a third position, known as the sales maximising position, i.e. where AC = AR. This results in the lowest sale price, but the largest quantity of output. This can lead to ‘brand proliferation’ and would serve as a barrier to new firms thinking about entering the market.
Why do firms choose not to produce at the profit maximising position:
To leave less market share for competitors or potential competitors.
To protect the firm in the event of a future threat to demand.
Firms may fear a negative reaction from the government if profits are excessive.
An alternative method of displaying Baumol’s Model:
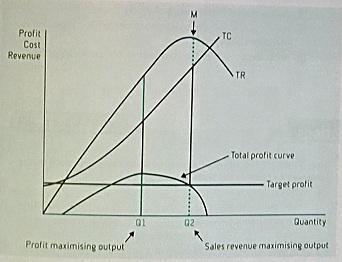
Note how maximising sales revenue is different from maximising profits.
Market Concentration:
Market concentration is used when smaller firms account for a large percentage of the total market. It measures the extent of domination of sales by one or more firms in a particular market. One method of calculating the level of concentration is the four-firm concentration ratio. The four-firm concentration ratio is calculated based on the market shares of the largest firms in the industry. A four-firm concentration ratio over 90 (that is, 90 percent of industry output is produced by the four largest firms) is a good indication of oligopoly and that these four firms have significant market control.
I have explained both the Four-Firm Ratio, and the HHI in this video on the Market Concentration Ratios.
Alternatively a four-firm concentration ratio of 0.001 (that is, the four largest firms are responsible for one-thousandth of one percent of industry output) is good indication that the industry is monopolistically competitive and that the four largest firms have very little market control. However, because there is a fine line between oligopoly and monopolistic competition, there is no distinct concentration ratio that can be used to separate one market structure from the other.
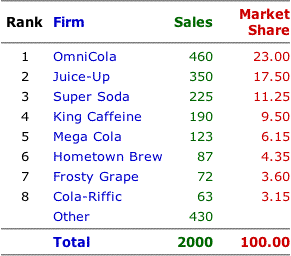
The formula used is:
S1 + S2 + S3 + S4/Total market.
Looking at the figures presented, that would be:
23 + 17.50 + 11.25 + 9.50/100
=61.25%
A ratio of 0 – 50% is considered low and indicative of perfect or imperfect competition.
Between 51 and 80% is classified as medium concentration, i.e. Oligopoly.
Between 81 and 100% is highly concentrated as in Olioopoly or Monopoly.
Another common method of calculating market concentration is the HHI:
The HHI usually measures the largest 50 firms in the industry.
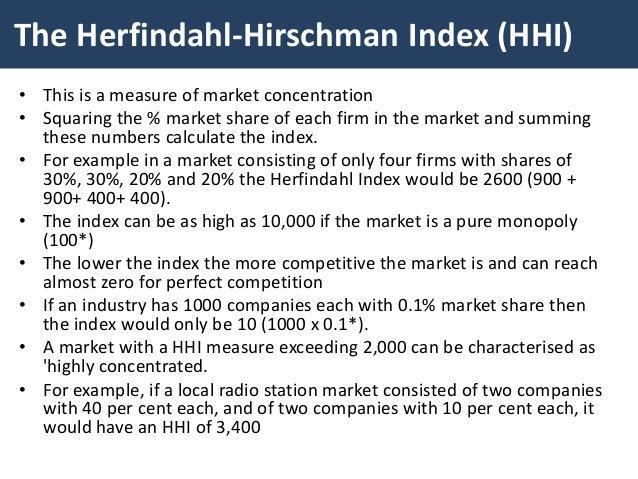
When calculating the Herfindahl–Hirschman Index (HHI) in Market Concentration, you should first check whether you have been given market shares, or raw sales data. If it's the latter, you must convert these figures to percentages before proceeding. Click here to view an explanation.
Regulation of the market:
Both consumers and regulators are interested in market concentration due to the possible abuse of their market dominance by a small number of firms. The European Commission assesses the likely competitive impact of mergers to see if there may be any adverse consequences for consumers, e.g. higher prices, lower quality goods, less choice.
In order to avoid these consequences, market concentrations are regulated by Irish and EU competition authorities like:
Commission for Regulation of Utilities (CRU): which monitors the electricity and gas markets.
Competition and Consumer Protection Commission (CCPC): which has the power to investigate businesses alleged to be involved in anti-competitive practices like price fixing. The CCPC can block mergers from happening if it thinks such a move would reduce competition and harm consumers.
European Competition Network (ECN): The European Commission and the national competition authorities in EU member states cooperate with each other through the ECN to ensure that rules are applied consistently and fairly throughout the EU.
Strand 3 .2 The Labour Market.
What Is a Factor Market?
A factor market is a market in which companies buy the factors of production or the resources they need to produce their goods and services. Companies buy these productive resources in return for making payments at factor prices. This market is also referred to as the input market.
A factor market is different from the product, or output, market—the market for finished products or services. In the latter, households are buyers and businesses are sellers. But in a factor market, the reverse is true: households are sellers and businesses are buyers. The primary difference between product markets and factor markets is that factors of production like labor and capital are part of factor markets and product markets are markets for goods. The relationship between the factor market and the product market is determined by derived demand, or the demand for productive resources, as determined by the demand for goods and services output, or products. When consumers demand more goods and services, producers increase their demands for the productive resources used to make those goods and services.
In order to effectively examine the labour market, I want to examine it in the context of the factors of production, of which labour is one.
The demand for the factors of production is a ‘derived demand’ meaning that the good is not demanded for its own sake but for its use in the productive process.
MPP/MRP:
Marginal Physical Productivity (MPP) measures the extra unit of output generated by employing an extra unit of a factor of production.
Marginal Revenue Productivity (MRP) refers to the extra unit of revenue generated by employing an extra unit of a factor of production.
Factors that affect MPP and MRP:
The quality of the factor – the better skilled the factor of labour the more productive he/she will be.
The Law of Diminishing Returns – beyond a certain point output will eventually decrease.
The ability of the entrepreneur/employer – the ability to organise is crucial to the productive process.
The selling price of the product – the higher the selling price the higher the MRP of the factor, even if it is relatively inefficient.
Certain difficulties arise when measuring the MRP of workers who don’t produce anything, e.g. how does one measure the MPP or the MRP of teachers?
Supply Price, Economic Rent, Transfer Earnings, Quasi Rent and Rent of Ability:
The supply price of a factor of production is the lowest payment needed to bring a factor into use and keep it in that particular employment.
Economic rent is a payment to a factor in excess of its supply price.
Transfer earnings are what a factor could earn in its next best alternative employment/use.
Quasi rent is a short term economic rent paid to labour. It will not last into the long run as other workers will be attracted into the industry thereby driving wages back down. A quasi rent is caused by some element of market failure.
Rent of ability is where an economic rent exists into the long term.
The Factors of Production:
1. Land:
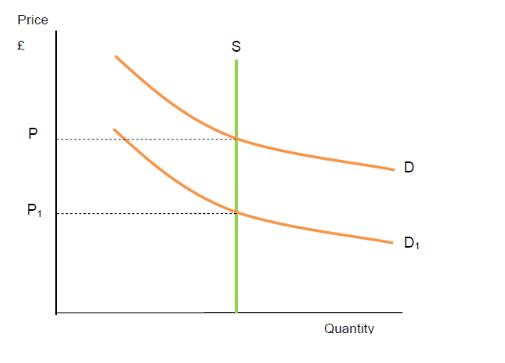
Land refers to anything provided by nature that is used to produce goods or services. The economic characteristics of land are as follows:
It is fixed in supply, as shown in the diagram opposite.
It has no cost of production.
All income from land is economic rent.
It is a non-specific factor of production meaning that it can be put to many uses.
The Irish Housing Market:
The demand for land in the decade leading up to 2007 put huge upward pressure on property prices. The reasons were as follows:
The increased population both from immigrants and Irish emigrants returning home from overseas employment.
Low interest rates and significantly increased availability of credit. The rate of interest reached historically low levels during “the boom”. Banks also relaxed their lending criteria to the extent that people were able to borrow several multiples of their gross annual earnings. This limit increased from 2.5 times annual gross salary to 5 and even 10 times annual salary. Anglo-Irish Bank went well beyond that. One tradesman in Dublin was able to secure a mortgage of 37 times his annual income!
Investment/Speculation. Due to the strength of the rental sector of the Irish property market many ‘ordinary’ people bought second and third properties in order to earn rental income.
Increased employment and incomes. The buoyant economy of the “Tiger” era boosted demand for property.
Increased demand for land. Land was demanded for a variety of reasons during the boom, e.g. new motorways and ring-roads, agriculture and forestry, new factories and schools.
2. Labour:
Labour is any physical effort used in the productive effort. The MPP of labour is the extra unit of output generated by hiring one extra worker.
MPP is the extra output generated by hiring an extra unit of labour. As the diagram shows, MPP slows up first (due to specialisation), then starts to slope down (this is caused by the Law Diminishing Marginal Returns).
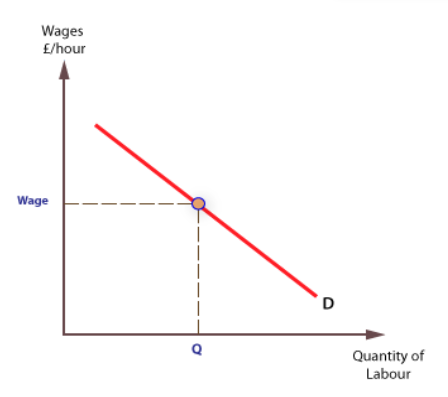
The MRP of labour also slopes up at first, then down for the same reasons:
The downward sloping part of the MRP curve is also the demand curve for labour, as seen in the diagram opposite (and in the video).
The law of demand also causes the demand MRP curve of labour to slope downward as the firm has to charge less if it wants to sell more. This means that workers earn less revenue for the firm as the market price of the goods they are marking falls.
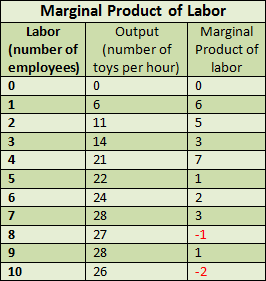
Marginal Physical Product and the Marginal Revenue Productivity of Labour:
The marginal physical product of labour (MPL) is the change in output that results from employing an added unit of labour. This is not always equivalent to the output directly produced by that added unit of labor; for example, employing an additional cook at a restaurant may make the other cooks more efficient by allowing more specialization of tasks, creating a marginal product that is greater than that produced directly by the new employee. Conversely, hiring an additional worker onto an already crowded factory floor may make the other employees less productive, leading to a marginal product that is lower than the work done by the additional employee. The chart opposite shows the MPP of labour in a toy factory.
The marginal revenue product of labour (MRPL) is the change in revenue that results from employing an additional unit of labour, holding all other inputs constant. The marginal revenue product of a worker is equal to the marginal product of labor (MPL) and the marginal revenue (MR) of output, given by MR×MP: = MRPL. This can be used to determine the optimal number of workers to employ at a determined market wage rate. Theory states that a profit maximising firm will hire workers up to the point where the marginal revenue product is equal to the wage rate, because it is not efficient for a firm to pay its workers more than it will earn in revenues from their labour.
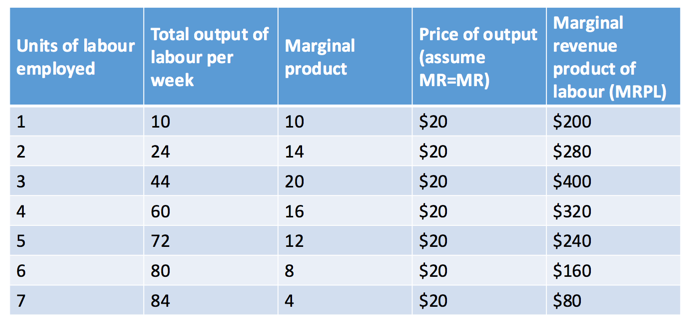
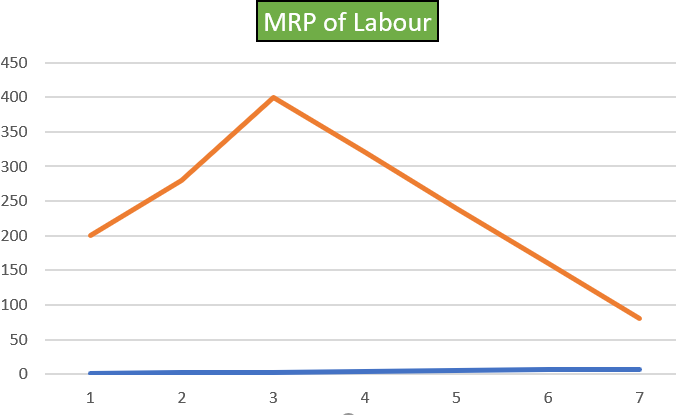
The MRP of labour, based on the information in the graph (the downward sloping portion is the demand curve for labour) is depicted here:
Factors affecting MPP:
The quality of the factor.
The level of training provided for staff.
The expertise of the entrepreneur.
The law of diminishing marginal returns.
Factors affecting MRP:
The productivity of the factor.
The selling price of the output.
The law of demand.
The Labour Market:
The demand for labour is dependent on the following factors:
The productivity of the worker: the MPP and MRP of a potential worker will influence the demand for labour.
Demand: the demand for the goods being produced.
Technology: better technology may negatively impact the demand for labour.
Taxes: Employer’s PRSI increases the cost of hiring a worker. This is why many employers are currently lobbying the government to reduce employer’s PRSI.
Grants/Subsidies: Some businesses qualify for grants/subsidies towards the cost of hiring staff.
The Supply of Labour:
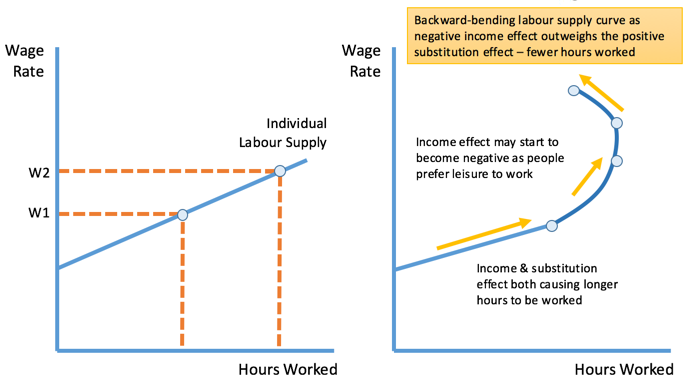
The supply curve of labour is upward sloping reflecting the fact that the higher the wage rate the greater the supply of labour. The supply of labour also depends upon:
The size of the population: The large proportion of our population who are of working age and high levels of immigration have increased the size of the labour force in Ireland.
The participation rate: The greater the willingness to work in a country the greater the supply of labour. The participation rate can be influenced by a number of factors like the level of social welfare provisions, the general state of the economy, social attitudes to working, and the compulsory ages of school leaving and retirement. Other factors include the level of taxation (higher levels mean people are less likely to supply their labour), the length of the working week, and labour mobility (examined below).
Holiday entitlements and hours of work: Less holidays and longer working hours increase the supply of labour.
The wage levels available in the economy: The higher the wage rate in any sector of the economy the more willing people will be to supply their labour.
The diagrams below show the supply curve for labour, but also what happens as the wage rate continues to rise (backward bending supply curve of labour).
Different wage rates for different jobs:
Factors affecting the rate of pay include:
Skills/cost of training: this explains why a doctor gets paid more than a nurse.
Degree of risk involved: an army bomb disposal expert can expect to earn more than an army desk officer.
Nature of the job: a school caretaker may earn more if he works in a large secondary school rather than a small primary school.
Productivity of the worker: more productive workers can expect higher wages.
Societal value: Some jobs pay very well simply because society says so, e.g. it is expected that you pay your accountant more than your barber.
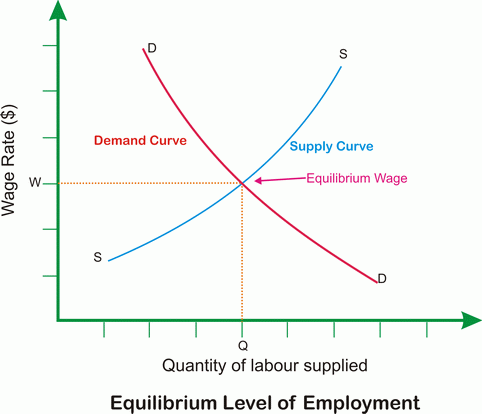
The diagram shows how the equilibrium wage rate is arrived at. The diagram ignores the involvement of trade unions which might not allow labour to be supplied below a certain minimum wage.
The Minimum Wage:
Arguments for:
Increases the standard of living for the poorest and most vulnerable class in society and raises average.
Motivates and encourages employees to work harder.
Does not have budget consequences on the government. "Neither taxes nor public sector borrowing requirements rise."
Minimum wage is administratively simple; workers only need to report violations of wages less than minimum, minimizing a need for a large enforcement agency.
Stimulates consumption, by putting more money in the hands of low-income people who spend their entire paychecks.
Increases the work ethic of those who earn very little, as employers demand more return from the higher cost of hiring these employees.
Decreases the cost of government social welfare programs by increasing incomes for the lowest-paid.
Does not have a substantial effect on unemployment compared to most other economic factors, and so does not put any extra pressure on welfare systems.
Arguments against:
Hurts small businesses more than large businesses.
Reduces quantity demanded of workers. This may manifest itself through a reduction in the number of hours worked by individuals, or through a reduction in the number of jobs.
Reduces profit margins of business owners employing minimum wage workers, thus encouraging a move to businesses that do not employ low-skill workers.
Businesses try to compensate for the decrease in profit by simply raising the prices of the goods being sold thus causing inflation and increasing the costs of goods and services produced.
Does not improve the situation of those in poverty, it benefits some at the expense of the poorest and least productive.
Discourages further education among the poor by enticing people to enter the job market.
Causes outsourcing and loss of domestic manufacturing jobs to other countries.
Excludes low cost competitors from labor markets, hampers firms in reducing wage costs during trade downturns (etc.), generates various industrial-economic inefficiencies as well as unemployment, poverty, and price rises.
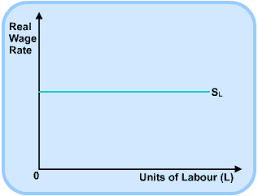
The horizontal supply curve of labour:
In a perfectly competitive market, the individual firm whose demand for labour is so small that it does not influence the wage rate would face a horizontal supply curve of labour, as seen in the diagram.
Consider what would happen if a higher tax rate was applied to labour. In this case the worker must receive a higher wage in order to offset the tax increase. This shifts the supply curve to the left, by the amount of the tax. The diagram shows that at point A the market was in equilibrium, with quantity of labour Q* being supplied for salary S*. With the imposition of the tax, the supply curve shifts to the left with Qt labour now being supplied for Sp. However, the worker does not receive Sp (this is simply the amount the employer must pay to secure the services of the worker), but rather receives Sr. Therefore, an income tax increase will result in:
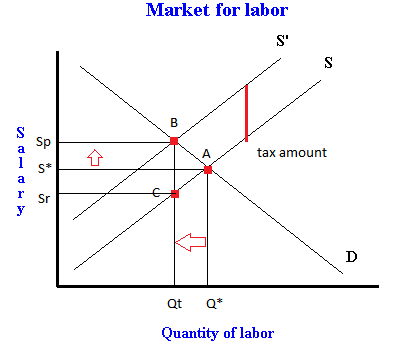
a lower quantity of labour being supplied to the market as people either stop working, or work fewer hours;
a higher salary paid by employers;
a lower salary received by employees.
Therefore, an income tax increase has a negative effect on the economy, yet the government may still need to impose it in order to fund public services. This is a classic example of the conflicting nature of economic policies, where a policy can be intended to help people (through the funding of better public services) yet actually end up hurting people (through lower take-home-pay).
Restricting entry to a profession:
Some professions may curtail the admission of newly qualified staff by increasing the standards for entry into the profession. This will also shift the supply curve to the left, as shown in the diagram above. Again, the result will be a lower quantity of labour supplied for a higher salary.
Trade unions and wage rates:
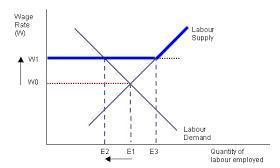
The wage rate W1 is set by the trade union, therefore no labour can be supplied below that level. If the demand curve for labour shifts to the right (as it would when the economy grows), the wage rate will go up, but it cannot fall below W1 when times are hard. We have the concept of a ratchet economy in economics which describes a situation where prices and wages go up when demand increases, but don't go down when demand falls.
A wage drift occurs when wage levels rise above negotiated levels. This occurs when the demand for labour increases beyond the available supply at the negotiated wage rate.
The mobility of labour:
Geographical mobility refers to the willingness of workers to move from one place to another. Factors affecting geographical mobility include availability of housing, social infrastructure, availability of adequate schools and hospitals, and the level of government support in place to help people relocate.
Occupational mobility refers to the willingness or ability of workers to move from one occupation to another. Factors here include levels of education and training, government policies and even trade union barriers.
Factors affecting the efficiency of labour (quite similar to those that affect MPP):
The quality of the factor.
The level of training provided for staff.
The expertise of the entrepreneur.
The innate talent of the worker.
The quality of the other factors available to the worker.
Living conditions of the worker.
Dedication of the worker.
The law of diminishing marginal returns.
Employment and Unemployment:
Full employment: refers to a situation where everyone who wants a job can find one. If employment reaches 96.4% there is said to be full employment (some people will never work no matter what opportunities are available).
The labour force: comprises those in employment and those who are seeking work.
The participation rate: refers to the proportion of the population of a country that is in the labour force.
Underemployment: refers to workers whose skills or talents are not used to their full potential.
The unemployment rate: is expressed as a percentage of unemployed people relative to the labour force.
Types of Unemployment:
Frictional Unemployment: this is unemployment that results from people who are “between jobs”, e.g. a teacher who loses his job in May and who will start teaching in a new school in September is said to be ‘frictionally’ unemployed for three months. A second example of frictional unemployment is where a builder in Cavan is laid off due to lack of work, yet there may well be work available in Dublin.
Structural Unemployment: this occurs where there are changes in the structure of industry resulting in a mismatch between the skills of jobseekers and the jobs that are available. An example would be where unemployed builders cannot ‘retro-fit’ houses with new thermal insulation as they do not have the required expertise.
Seasonal Unemployment: this is unemployment that results from a change in the time of year, e.g. a hotel worker may find themselves unemployed during the winter months.
Causes of unemployment:
Frictions in the labour market.
Lack of skilled workers.
Improvements in technology.
Seasonal factors.
Recession.
Measuring unemployment:
There are 2 main methods in Ireland for measuring our unemployment rate:
The Live Register: this is a record of all those in receipt of social welfare payments.
The Quarterly National Household Survey (QHNS): this is a survey of 39,000 households carried out every quarter and the employment status of those surveyed is used as an indication of the national unemployment rate.
Both surveys yield different results, but the QHNS is regarded as being more accurate due to the following problems with the Live Register:
The Live Register is signed by everybody receiving an unemployment-related welfare payment. However, some of these people may be in employment while legally receiving social welfare payments as part of a scheme, e.g. the back-to-work allowance. This results in a larger unemployment figure than the QHNS.
Some people work on the ‘black’ or even ‘grey’ economy while illegally claiming social welfare payments. This again means that the Live Register figure will be larger than the QHNS figure.
By definition, an unemployed person must be available for and actively seeking work. Some people who are on the dole have no interest in finding work, yet, they still add to the Live Register figure.
In rare cases, someone could find themselves unemployed yet not want the bother of applying for social welfare. Such a person would show up on the QHNS.
3. Capital:
Capital: is anything man-made that is used in the production of goods or services.
Investment: (capital formation) refers to the production/formation of capital goods.
Gross investment: refers to all capital spending, both on new capital and on replacing worn out or damaged capital.
Net investment: refers to investment that does not include spending on the replacement of capital goods, i.e. gross investment minus depreciation.
Capital widening: this involves increasing the amount of capital so that the ratio between capital and labour remains unchanged.
Capital deepening: this involves increasing the amount of capital by a higher percentage than the increase in labour, so that the ratio between capital and labour increases.
Fixed capital: this refers to fixed assets, e.g. land, machinery, factory buildings.
Social capital: refers to capital owned by society, e.g. footpaths, parks.
Factors that affect the level of investment in the economy:
The expectations of entrepreneurs: a more optimistic outlook leads to higher levels of investment.
Low interest rates: “cheap” (low interest) money from Europe fuelled the property boom in Ireland during the ‘noughties’.
Inflation: higher levels of inflation tend to dampen optimism in the economy.
Taxation: Ireland’s low corporation tax is seen by the government as crucial to our economic recovery.
Incentives and grants: the IDA Ireland provides incentives to foreign companies to locate in Ireland.
Increased demand: the higher the level of demand the more likely entrepreneurs are to invest in the economy.
The MEC of Capital: this refers to the marginal efficiency of capital which is the extra profit generated by employing an extra unit of capital.
Foreign Direct Investment (FDI):
IDA Ireland is the state agency responsible for attracting foreign firms to locate in Ireland. Foreign companies like Dell, Intel, Microsoft, Google have located here for a variety of reasons:
Grants/subsidies and tax incentives: these help to encourage investment.
Low corporation tax: currently 12.5% which compares favourably with 15% in Germany, 25% in the UK and 25% in Spain. Click here for other corporaton tax rates.
The availability of a highly skilled and flexible workforce: this explains why so many technology companies locate here.
Good infrastructure: examples of which include the Dublin Port Tunnel, rail improvements, the building of motorways and town by-passes.
Location: Ireland’s proximity to Europe and the fact that we are English-speaking make us an attractive location.
Relocation of Multinationals out of Ireland:
Lower costs abroad: Fruit-of-the-Loom, an American textiles company relocated to Morocco where labour costs were much lower. Land costs can also be lower in African countries.
Corporation Tax: We are not the only country offering low corporation tax; in Poland it is 19% and only 9% in Hungary. Click here for corporation tax rates in Europe.
Availability of skilled and flexible labour: In Poland over 45% of 20-24 year olds have higher education qualifications. Approx. 280,000 students graduate each year.
Access to markets: Eastern European countries are closer to the population centres of Central Europe as well as to the huge Asian markets.
Incentives: Poland, for example, has established 14 special economic zones that are designated areas for investment with preferential terms, grants and tax incentives are provided to firms that locate in them.
Factors that Determine the Interest Rate:
The rate charged by the commercial banks to its business customers on loans is determined by several factors:
Degree of Risk: a successful businessman might be charged a lower rate of interest than a first-time borrower.
Monetary policy of the ECB: If inflation is rising in the Euro-zone, then the ECB will raise interest rates to “take the heat” out of the Euro-zone economy.
Rate of inflation: The interest rate should be higher than the prevailing rate of inflation, otherwise the real value of the money being repaid decreases.
Effects of Rising Interest Rates:
Increased loan repayments: Mortgage repayments increase as does the cost of debt-servicing.
A fall in investment: people become less likely to borrow.
Increased savings: people are much more likely to save their money when interest rates are high so as to avail of the higher return.
Reduced inflation: less spending brought on by higher loan repayments brings prices down across the economy.
A slowdown in house prices: as the cost of repaying a mortgage increases, the demand for houses will fall.
The determination of interest rates:
The Classical Theory also called the ‘Loanable Funds’ Theory: Savers provide the funds that can be lent to borrowers to invest. The classical economists explained how the equilibrium interest rate (the rate that ensured the demand for and supply of loanable funds were equal) was determined as follows:
The demand curve for loanable funds slopes downwards. When interest rates were high, demand was low from borrowers, and when interest rates were low, savers saved less and so fewer funds were available.
If there were excess demand for the loanable funds, then the interest rate would rise until equilibrium was restored. If there were an excess supply of loanable funds, then the interest rate would fall until equilibrium was restored.
The Liquidity Preference Theory of John Maynard Keynes: Keynes’ theory showed that the rate of interest depended on the demand and supply of money. Liquidity preference refers to the desire of individuals to hold their wealth in liquid form. There are three reasons for this:
Transactions motive: People demand money for day-to-day transactions. The rate of interest has very little effect on this.
Precautionary motive: People demand money for emergencies. Again, the rate of interest has some effect on this.
Speculative motive: People demand cash so as to be able to take advantage of opportunities to make profit. In general, if the rate of interest is low people will hold their money in liquid form so they can avail of a good opportunity at short notice.
People also want to have money so they can buy government bonds.
Note: The Market Value of a (existing) Bond is:
Original price of bond x original interest rate
New rate of interest
E.g. a Eur100 bond bought at 7% and sold when the rate has climbed to 10% =
100 x 7/10 = Eur70.
As the interest rate increases, the value of the bond falls. This is because an investor could easily buy a new bond in order to avail of the higher rate. He will only buy the original bond if the price is competitive. There is an inverse relationship between the rate of interest and the market value of existing bonds.
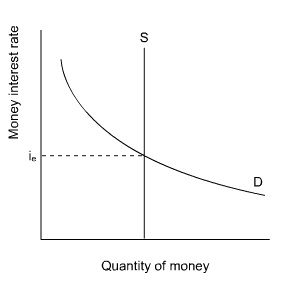
The Supply of Money:
The intersection of the demand and supply curves determines the interest rate. The supply of money is fixed.
Savings:
Savings = Income minus Consumption. People save for a variety of reasons:
Saving for future spending, e.g. children attending college.
Saving for the unexpected.
Saving to earn interest.
People sometimes save so as to improve their credit rating.
People save for their retirement.
Factors that influence the level of savings:
Income: The more one earns, the easier it is to save.
Rate of interest: The higher the rate, the more likely people are to save.
Rate on inflation: The higher this rate, the less likely people are to save as the purchasing power of their money is diminished by high inflation.
Government taxes: If DIRT is high the incentive to save is reduced.
Government schemes: The SSIA, introduced by Fianna Fail encouraged large numbers to save.
Liquidity trap: This occurs when the economy is stagnant, the nominal interest rate is close or equal to zero, and the monetary authority (ECB) is unable to stimulate the economy with traditional monetary policy tools. In this kind of situation, people do not expect high returns on physical or financial investments, so they keep assets in short-term cash bank accounts or hoards rather than making long-term investments. This makes the recession even more severe.
4. Enterprise:
An entrepreneur is a person who takes a risk by bringing the other three factors of production together in the hope of making a profit.
Economic characteristics of the entrepreneur:
Without the entrepreneur, the other three factors would not be brought into the productive process.
Profit is the reward of the entrepreneur. Since it is possible to earn a loss, the entrepreneur is the only factor that can earn a negative return.
The entrepreneur is only paid when all other factors have received their reward. His reward is said to be ‘residual’.
The reward of the entrepreneur can vary wildly, unlike any of the other factors.
Risk is a key element in the decision making process of the entrepreneur. There are two types of risk: insurable and uninsurable:
Insurable risks include fire, theft, public liability, product liability, employers’ liability.
Uninsurable risks include strikes by staff, new competition, downturn in the economy, changing tastes of consumers, new laws affecting the firm and so-called “acts of God” like floods or lightning damage. Risk is uninsurable when the risk to the insurance company is too great, or there are not enough people willing to share the risk, or it is too difficult to calculate the probability of the risk.
Importance of Entrepreneurs to the Economy:
Entrepreneurs organise and make use of the other factors of production.
Entrepreneurs improve consumers’ choices.
They provide employment.
They provide revenue for the government through PAYE, PRSI and tax on profits (Corporation tax).
They boost GDP.
They produce exports thus helping our balance of payments.
Strand 3.3 Market failure.
In theory markets function and solve the economic problem without any need for government intervention. This video explains many of the key concepts of market failure.
Complete or partial market failure:
Market failure happens when economic resources are not allocated efficiently. This is caused by the price mechanism in the market working imperfectly.
There may be a complete market failure which is a situation where a market does not exist. This is often referred to as a missing market. In this situation the government intervenes to provide the funding and resources to facilitate this service.
A partial failure occurs when the market produces a price or quantity supplied that is unsatisfactory. For example if the provision of healthcare services were left entirely to market forces then some people would most likely not be able to afford health care.
What factors lead to market failures?
1. Public and private goods.
Most goods that are consumed are private goods, e.g. eating a bar of chocolate, drinking a can of Coke. Private goods are excludable meaning you can stop someone from consuming them, e.g. if you drink a can of Coke it means someone else cannot. Private goods also exhibit rivalry, meaning you can prevent others from benefiting from that good.
Public goods are goods that would not be provided in a free market system and our goods that are consumed collectively, e.g. flood defence mechanisms, lighthouses, street lighting, defence forces, police service, etc. In contrast to private goods public goods have both of the following characteristics:
Non excludability, meaning people cannot be stopped from using the good even if they have not paid for it. It would be difficult to stop people benefiting from street lighting.
Non diminishability/non-rivalry which means that one person benefiting from the good does not stop others from also benefiting. This also means that public goods don't incur a marginal cost, i.e. there is no extra cost in extending the goods to one more person.
The benefits of a public good are available to all those who consume it and it's use cannot be withheld from any individual in the economy. This non excludability of public goods leads to what is known as the free rider problem. This means that once a public good is provided it is impossible to stop someone benefiting from it even if they have not paid towards its cost. Similarity consumers will not choose to pay for a good if they can get it for free. A private firm would not produce these goods as they cannot charge consumers and so the price mechanism cannot work.
2. Asymmetric information.
This market failure arises when one party ( consumer or producer) has more information than another party in an exchange. The market will fail as information is no longer perfect and those with extra information can exploit the situation to their advantage by charging higher prices and/or providing inferior quality goods.
A well-functioning market occurs when consumers can judge competing products effectively. This lack of information distorts this. A company, because of its market power, may produce information that is too technical or complicated making it difficult for consumers to interpret. There are also markets consumers no more than producers, e.g. the insurance market. To offset the potential cost of not knowing, insurance companies charge all consumers in the market more than if they had perfect information. Consumers know this and they also know that the risk is minimal and consequently they leave the market. This leaves the insurance company with only high risk customers. The market therefore fails as only high-risk customers are insured.
3. Externalities.
These are the effects on third parties that are not part of the market, i.e. they are neither consumers or producers of the good. An example of a positive externality is a homeowner having a landscape garden that provides scenic beauty to all who lived in his or her neighbourhood. A negative externality is the pollution that might come from a factory. Often the prices charged don't fully reflect the true cost, including the external effects of their production. The market fails as those who suffer loss in welfare are not compensated.
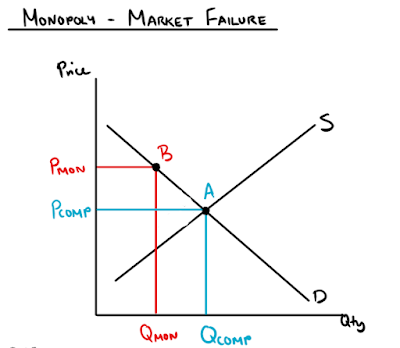
4. Monopoly power:
Monopolies tend to produce less and charge a higher price than companies in a more competitive market.
This diagram illustrates partial market failure under Monopoly:
Regulatory bodies and competition law:
Government's may introduce competition law to ensure competition in the marketplace, and to prevent companies from acting as cartels and charging artificially high prices. Furthermore, they may create agencies to oversee the workings of a market dominated by a few suppliers, e.g. ComReg ( the Commission for Communications Regulation), which monitors the telecommunications market preventing consumer exploitation.
Deregulation: This is the removal of government controls from an industry or sector to allow for a free and efficient market place, e.g. the taxi industry.
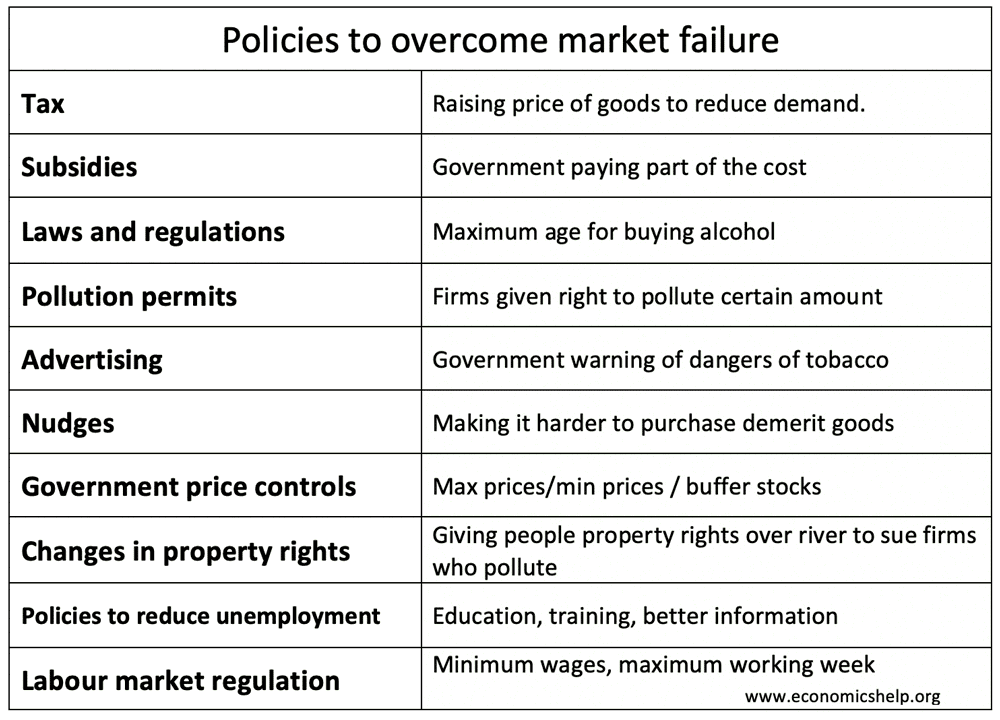
Taxation on negative externalities and subsidies on positive externalities: taxes on negative externalities such as pollution are intended to make consumers and/or producers pay the full social cost of the good. This reduces consumption and creates a more socially efficient outcome, e.g. cars have become more fuel efficient due to increased tax on petrol. Offering subsidies to those who reduce social costs offers an incentive to be more socially responsible, e.g. the bike-to-work scheme.
Now that you've finished this strand, why not test yourself on these notes.